33
/
AIzaSyB4mHJ5NPEv-XzF7P6NDYXjlkCWaeKw5bc
November 30, 2025
230224
Russian Federation
RUS
true
2
1
PNG, bonds (DIS, current US$)
2016,2015,2014,2013,2012,2010,2008,2007,2006,2005,2004,2003,2002,2001,1999,1998
Create a timeline
Public Timelines
For education
For educational institutions
For teachers
For students
Cabinet
For educational institutions
For teachers
For students
Open cabinet
FAQ
Close
Create a timeline
Public timelines
FAQ
About & Feedback
Terms
Privacy
FAQ
Support 24/7
Cabinet
Get premium
Donate
Download
Global statistics library
→
Russian Federation
→
PNG, bonds (DIS, current US$)
This statistics in other country:
Argentina
Armenia
Botswana
Brazil
Bulgaria
China
Colombia
Costa Rica
Dominican Republic
East Asia & Pacific (excluding high income)
Ecuador
Egypt, Arab Rep.
El Salvador
Europe & Central Asia (excluding high income)
Georgia
Ghana
Guatemala
IDA only
India
Indonesia
Jamaica
Kazakhstan
Lao PDR
Latin America & Caribbean (excluding high income)
Lebanon
Low & middle income
Lower middle income
Malaysia
Mexico
Middle East & North Africa (excluding high income)
Middle income
Mongolia
Nigeria
Pakistan
Panama
Paraguay
Peru
Philippines
Romania
Russian Federation
Serbia
South Africa
South Asia
Sri Lanka
Sub-Saharan Africa (excluding high income)
Thailand
Turkey
Ukraine
Upper middle income
Venezuela, RB
Vietnam
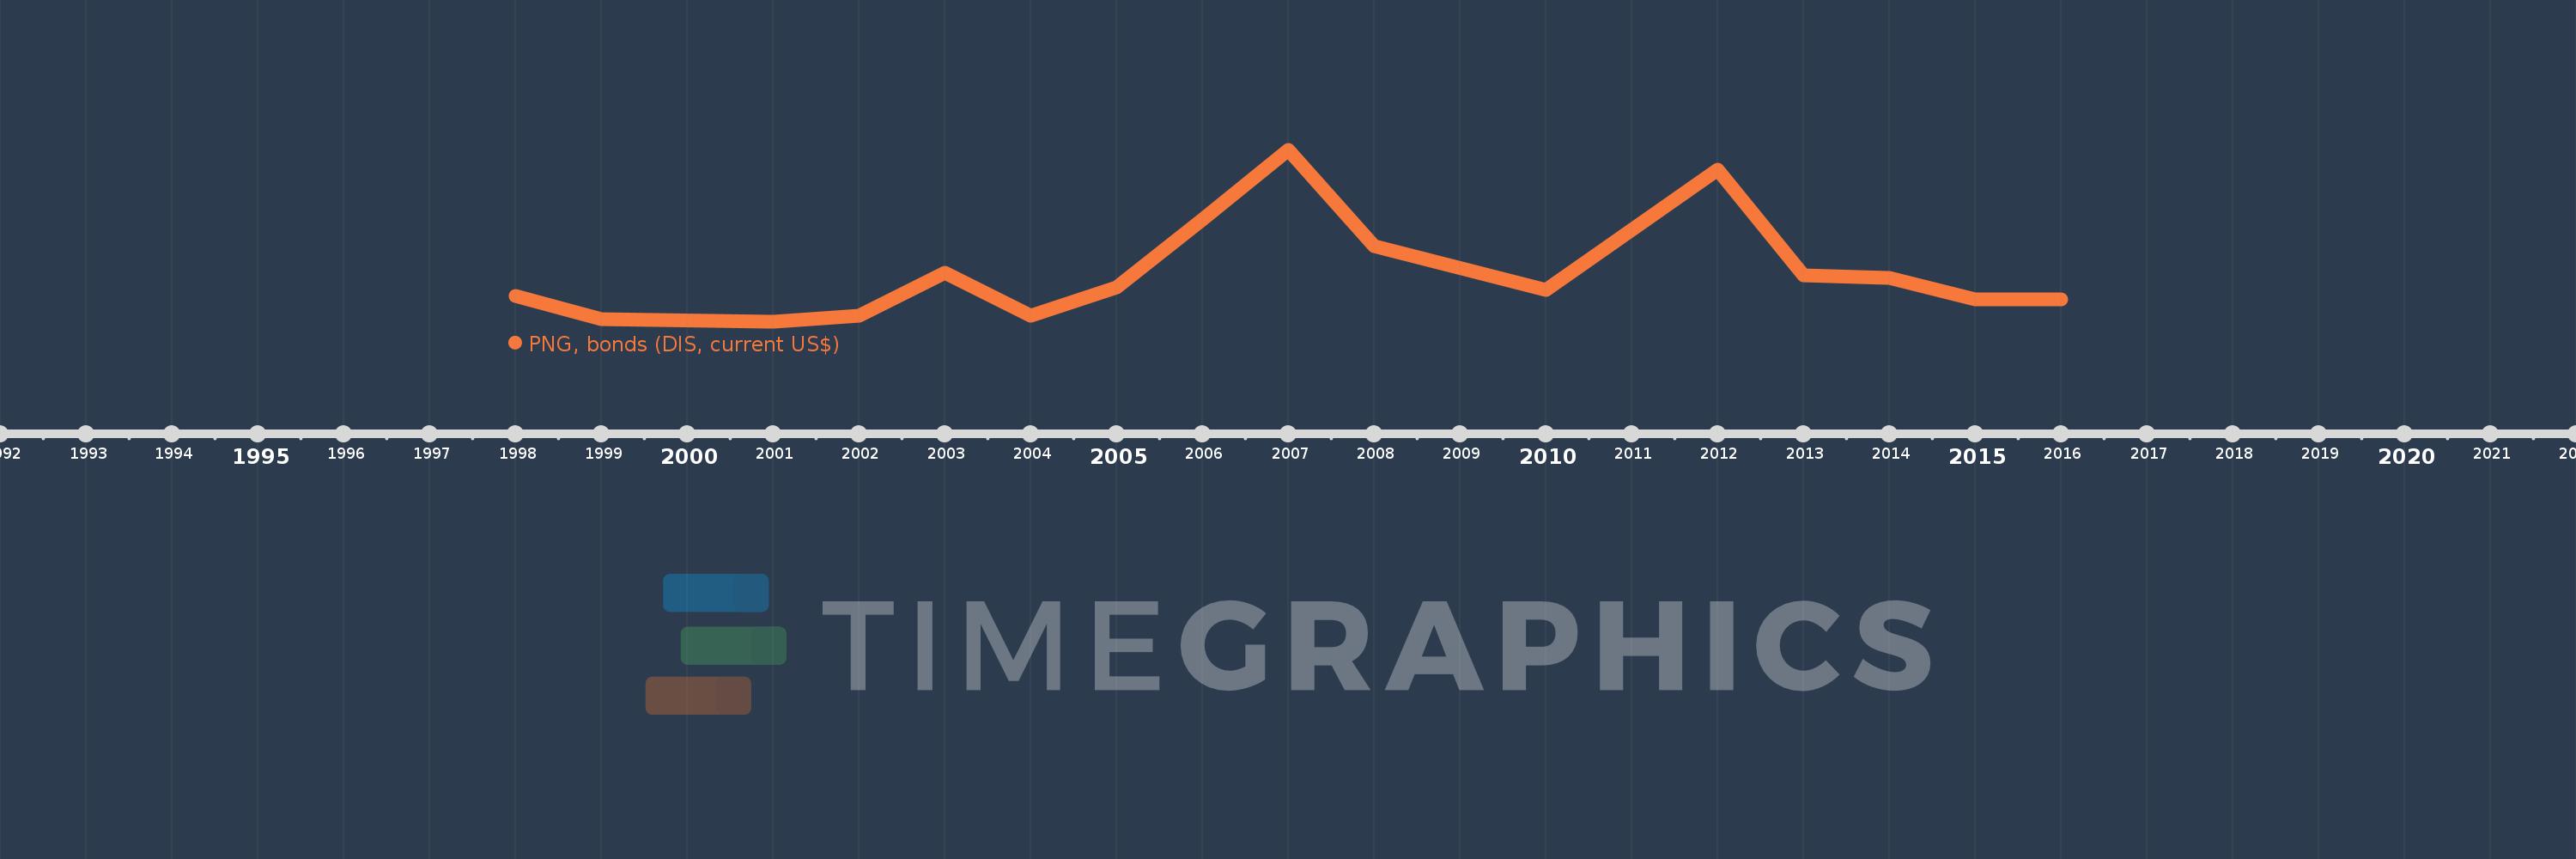
Timeline:
This timeline shows a graph from
1998
to
2016
of Russian Federation. No data until
1997
. Number of actual observations by date:
16
.
Source name:
World Development Indicators
Source organization:
World Bank, International Debt Statistics.
Categories, topics:
External Debt
Last updated:
apr 23, 2017
Indicators value changes by year
Meaning:
3.535 bln
Minimum:
75.0 mln
jan 1, 2001
Maximum:
12.04 bln
jan 1, 2007
At the date of observation
Value
Absolute change
Change from the previous value
jan 1, 1998
1.905 bln
+1.905 bln
0.0%
jan 1, 1999
278.049 mln
-1.627 bln
-85.4%
jan 1, 2001
75.0 mln
-203.049 mln
-73.03%
jan 1, 2002
527.83 mln
+452.83 mln
603.77%
jan 1, 2003
3.493 bln
+2.965 bln
561.74%
jan 1, 2004
517.953 mln
-2.975 bln
-85.17%
jan 1, 2005
2.515 bln
+1.997 bln
385.55%
jan 1, 2006
7.226 bln
+4.711 bln
187.33%
jan 1, 2007
12.04 bln
+4.814 bln
66.62%
jan 1, 2008
5.329 bln
-6.711 bln
-55.74%
jan 1, 2010
2.286 bln
-3.043 bln
-57.11%
jan 1, 2012
10.692 bln
+8.406 bln
367.75%
jan 1, 2013
3.299 bln
-7.393 bln
-69.14%
jan 1, 2014
3.12 bln
-179.636 mln
-5.44%
jan 1, 2015
1.64 bln
-1.479 bln
-47.43%
jan 1, 2016
1.62 bln
-20.077 mln
-1.22%
Ranking of countries by current statistics by years
About & Feedback
Terms
Privacy
FAQ
Support 24/7
Cabinet
Get premium
Donate
The service accepts bank transfer (ACH, Wire) or cards (Visa, MasterCard, etc). Processed by Stripe.
Secured with SSL