Download This statistics in other country:
Timeline:
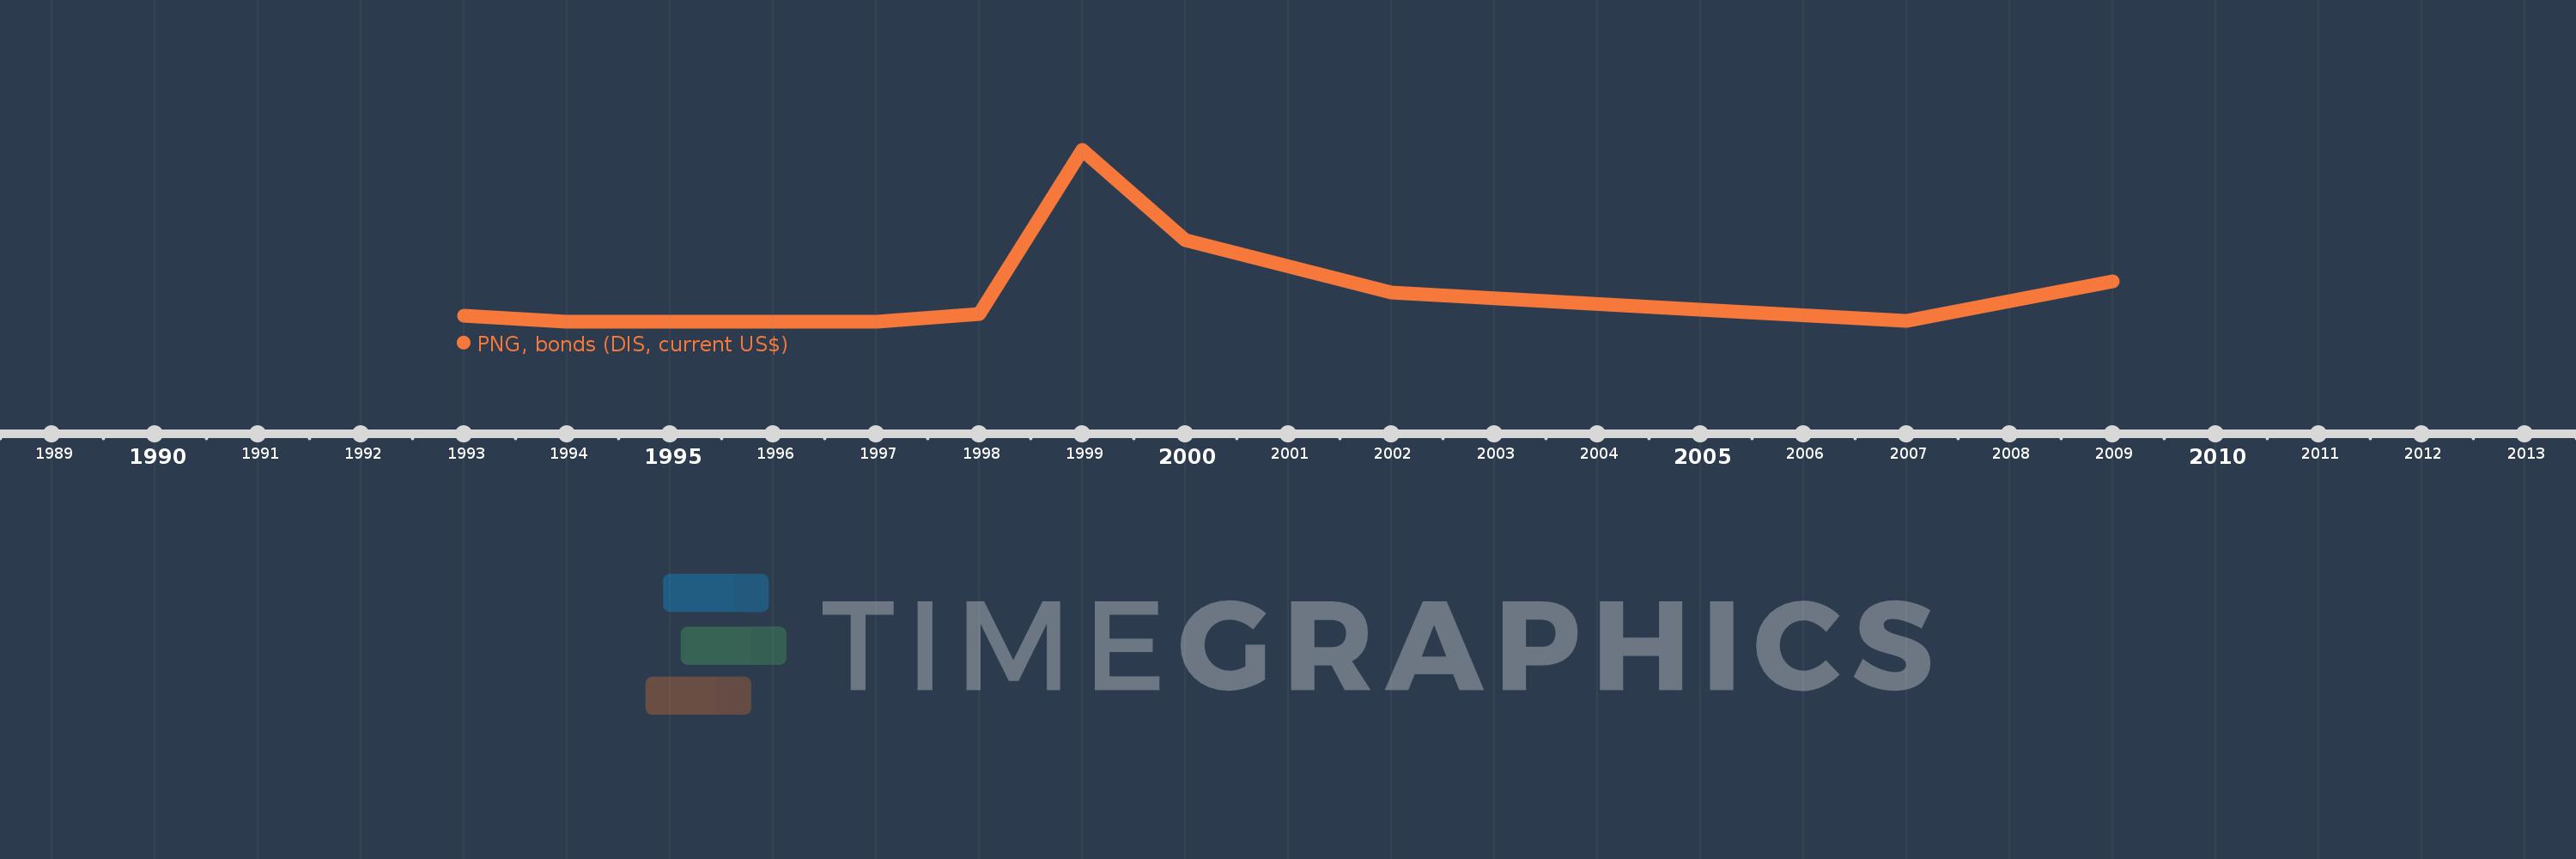
This timeline shows a graph from 1993 to 2009 of Venezuela, RB. No data until 1992. Number of actual observations by date: 10.
Source name:
World Development Indicators
Source organization:
World Bank, International Debt Statistics.
Categories, topics:
External Debt
Last updated:
apr 23, 2017
Indicators value changes by year
Minimum:
90.0 mln
jan 1, 1994
Maximum:
2.45 bln
jan 1, 1999
At the date of observation
Value
Absolute change
Change from the previous value
jan 1, 1993
174.0 mln
+174.0 mln
0.0%
jan 1, 1994
90.0 mln
-84.0 mln
-48.28%
jan 1, 1997
95.0 mln
+5.0 mln
5.56%
jan 1, 1998
200.0 mln
+105.0 mln
110.53%
jan 1, 1999
2.45 bln
+2.25 bln
1.13K%
jan 1, 2000
1.213 bln
-1.237 bln
-50.47%
jan 1, 2002
500.0 mln
-713.363 mln
-58.79%
jan 1, 2005
260.0 mln
-240.0 mln
-48.0%
jan 1, 2007
100.0 mln
-160.0 mln
-61.54%
jan 1, 2009
650.0 mln
+550.0 mln
550.0%
Ranking of countries by current statistics by years