Download This statistics in other country:
Timeline:
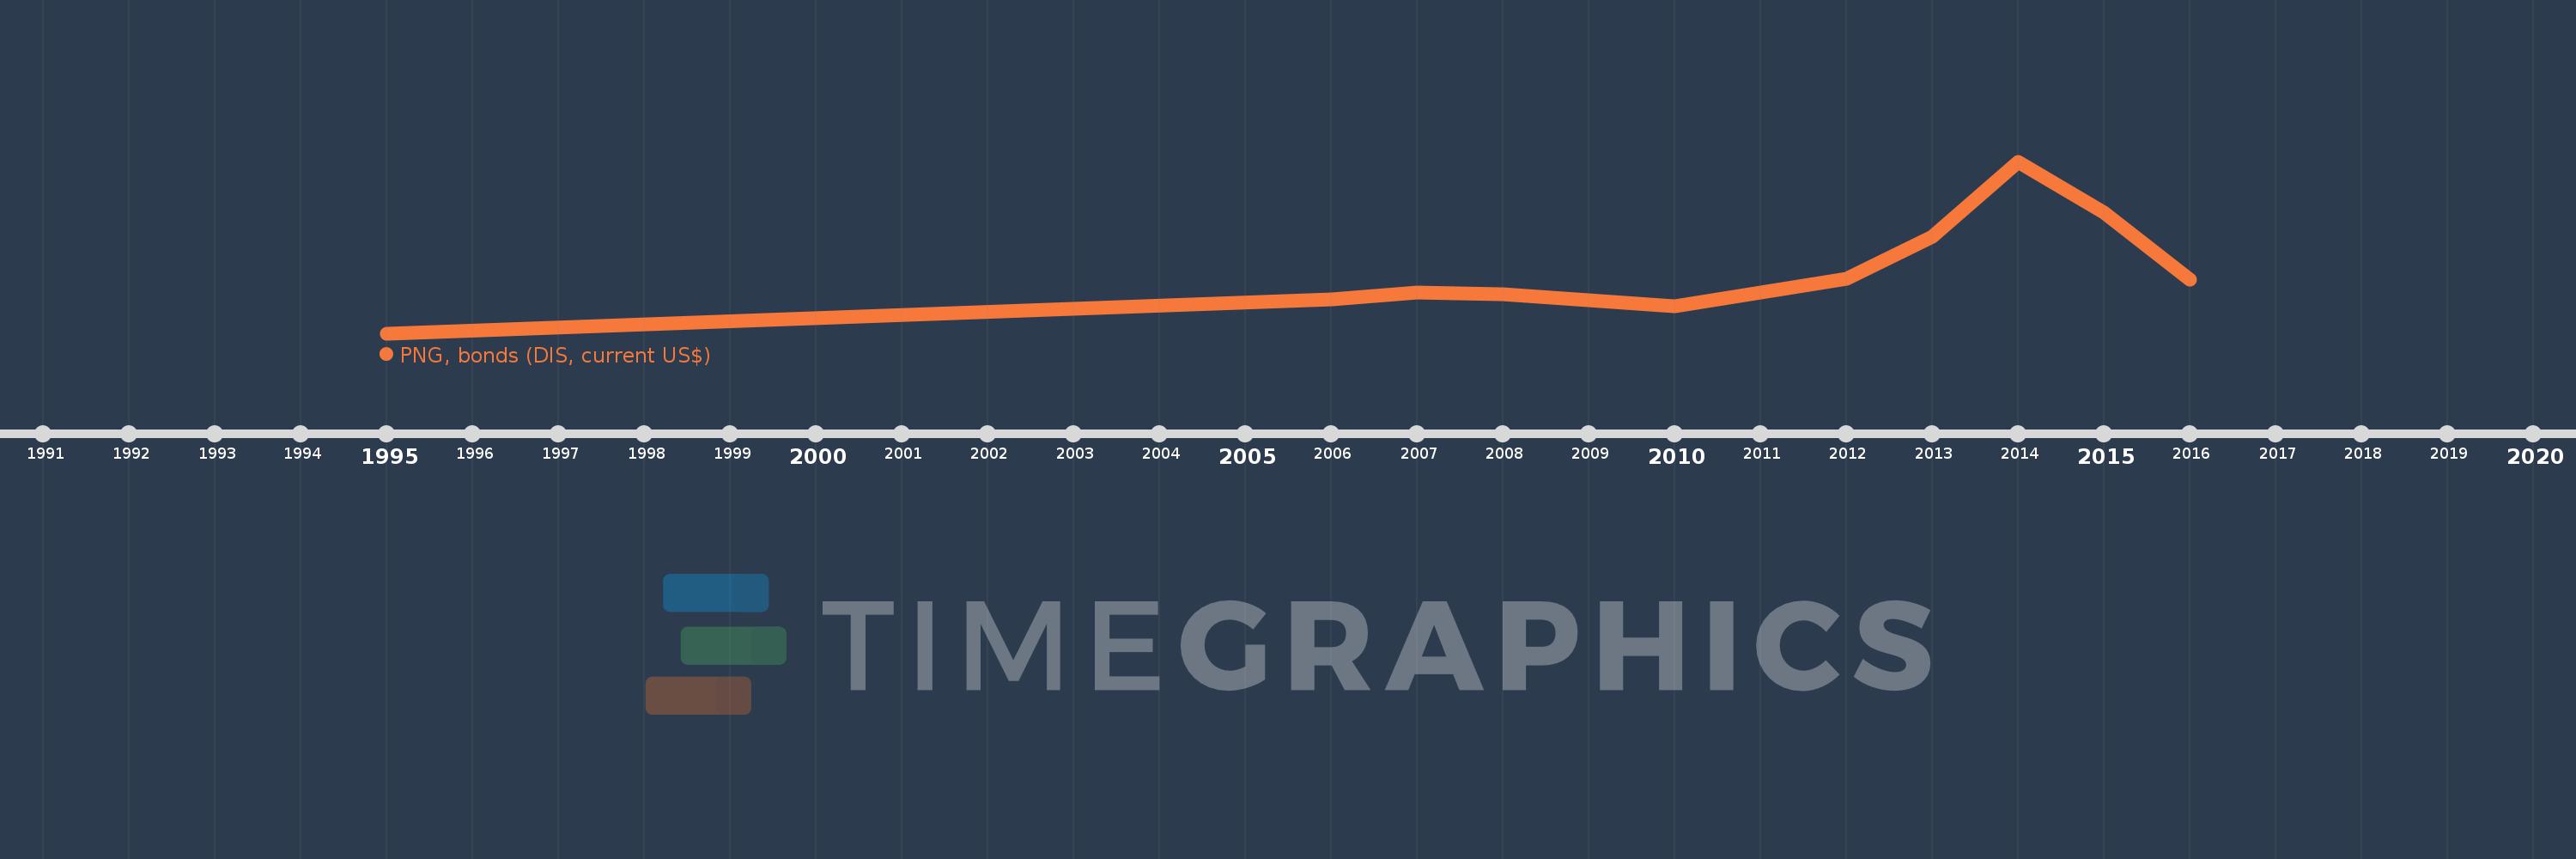
This timeline shows a graph from 1995 to 2016 of Peru. No data until 1994. Number of actual observations by date: 10.
Source name:
World Development Indicators
Source organization:
World Bank, International Debt Statistics.
Categories, topics:
External Debt
Last updated:
apr 23, 2017
Indicators value changes by year
Minimum:
60.0 mln
jan 1, 1995
Maximum:
5.22 bln
jan 1, 2014
At the date of observation
Value
Absolute change
Change from the previous value
jan 1, 1995
60.0 mln
+60.0 mln
0.0%
jan 1, 2006
1.08 bln
+1.02 bln
1.7K%
jan 1, 2007
1.292 bln
+212.0 mln
19.63%
jan 1, 2008
1.227 bln
-64.683 mln
-5.01%
jan 1, 2010
878.2 mln
-349.117 mln
-28.45%
jan 1, 2012
1.705 bln
+826.8 mln
94.15%
jan 1, 2013
2.96 bln
+1.255 bln
73.61%
jan 1, 2014
5.22 bln
+2.26 bln
76.35%
jan 1, 2015
3.686 bln
-1.534 bln
-29.39%
jan 1, 2016
1.679 bln
-2.007 bln
-54.46%
Ranking of countries by current statistics by years