33
/
AIzaSyB4mHJ5NPEv-XzF7P6NDYXjlkCWaeKw5bc
November 30, 2025
196048
Mexico
MEX
true
2
1
PNG, bonds (DIS, current US$)
2016,2015,2014,2013,2012,2011,2010,2009,2008,2007,2006,2005,2004,2003,2002,2001,2000,1999,1998,1997,1996,1995,1994,1993,1992,1991
Create a timeline
Public Timelines
For education
For educational institutions
For teachers
For students
Cabinet
For educational institutions
For teachers
For students
Open cabinet
FAQ
Close
Create a timeline
Public timelines
FAQ
About & Feedback
Terms
Privacy
FAQ
Support 24/7
Cabinet
Get premium
Donate
Download
Global statistics library
→
Mexico
→
PNG, bonds (DIS, current US$)
This statistics in other country:
Argentina
Armenia
Botswana
Brazil
Bulgaria
China
Colombia
Costa Rica
Dominican Republic
East Asia & Pacific (excluding high income)
Ecuador
Egypt, Arab Rep.
El Salvador
Europe & Central Asia (excluding high income)
Georgia
Ghana
Guatemala
IDA only
India
Indonesia
Jamaica
Kazakhstan
Lao PDR
Latin America & Caribbean (excluding high income)
Lebanon
Low & middle income
Lower middle income
Malaysia
Mexico
Middle East & North Africa (excluding high income)
Middle income
Mongolia
Nigeria
Pakistan
Panama
Paraguay
Peru
Philippines
Romania
Russian Federation
Serbia
South Africa
South Asia
Sri Lanka
Sub-Saharan Africa (excluding high income)
Thailand
Turkey
Ukraine
Upper middle income
Venezuela, RB
Vietnam
Timeline:
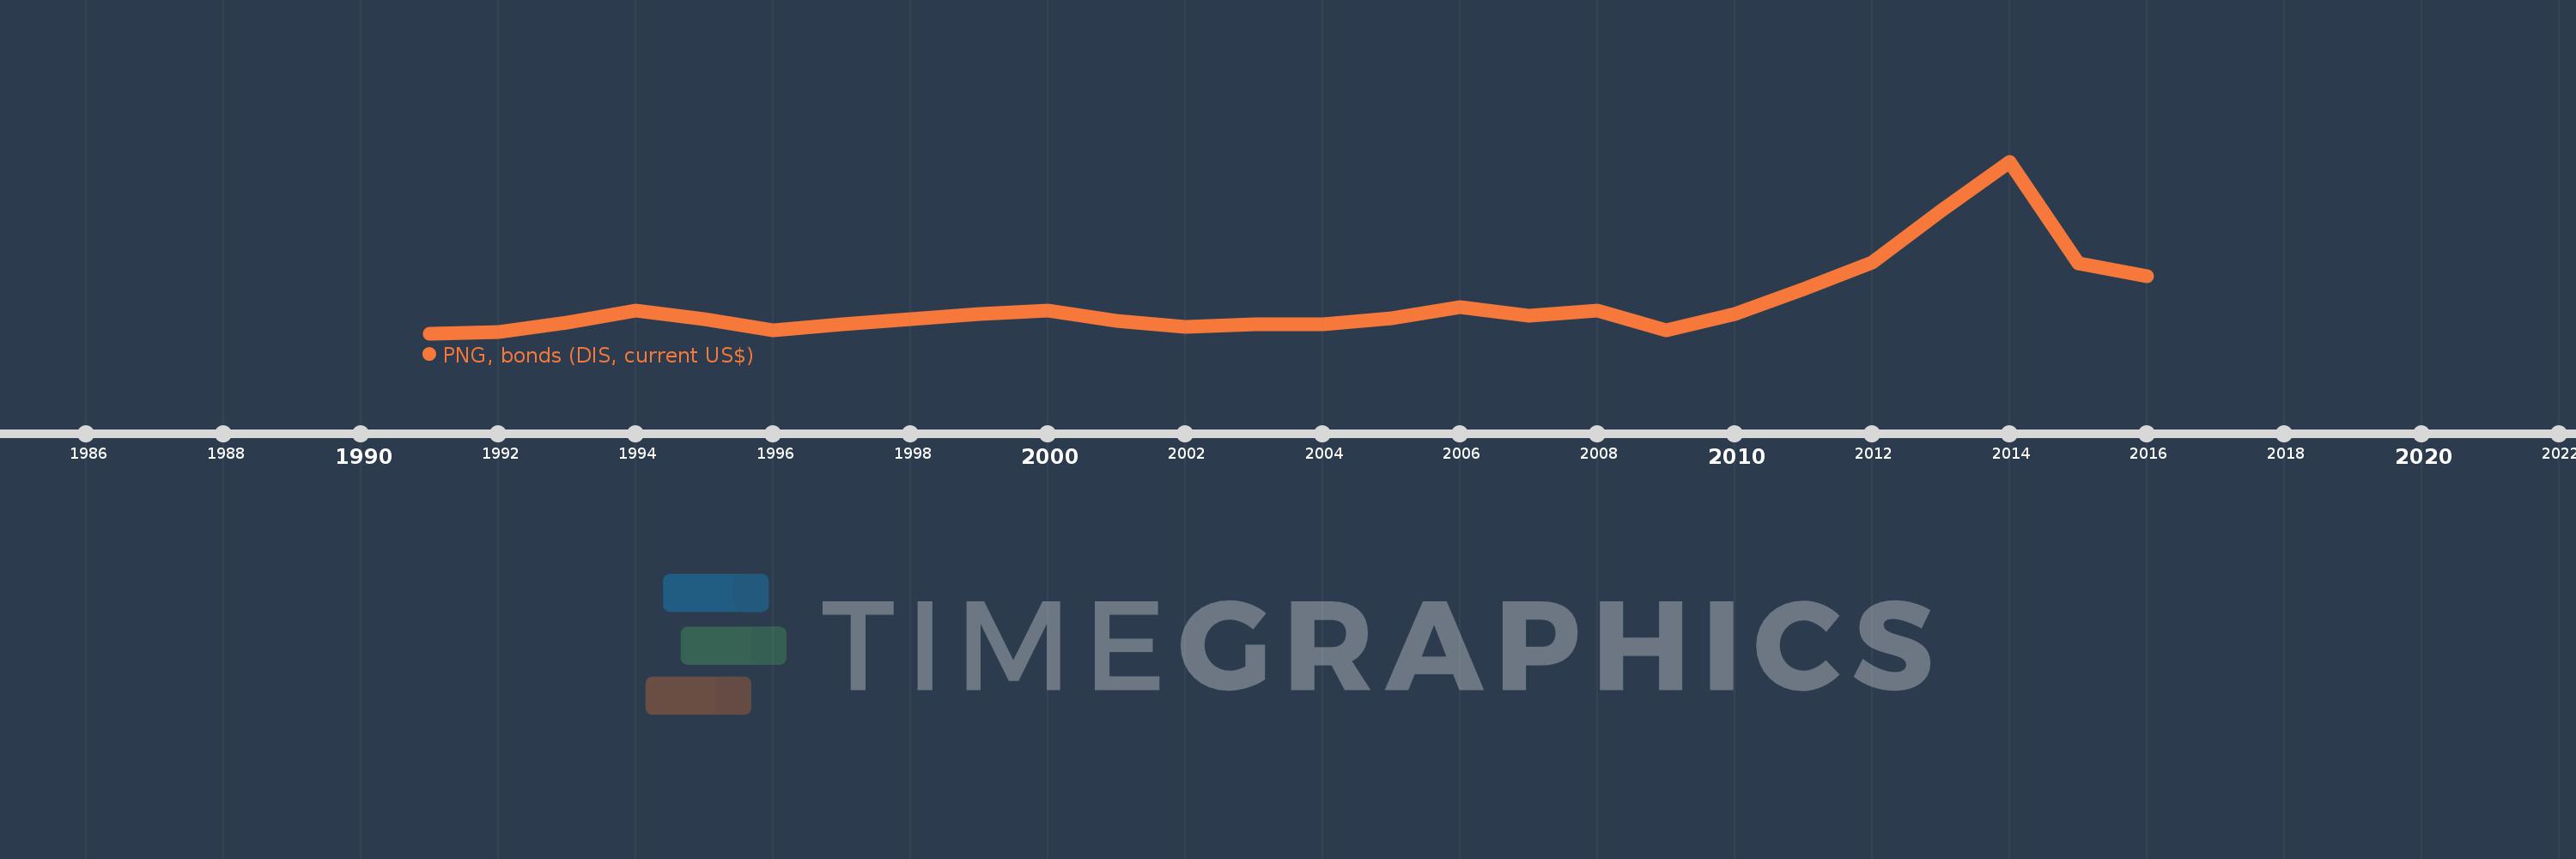
This timeline shows a graph from
1991
to
2016
of Mexico. No data until
1990
. Number of actual observations by date:
26
.
Source name:
World Development Indicators
Source organization:
World Bank, International Debt Statistics.
Categories, topics:
External Debt
Last updated:
apr 23, 2017
Indicators value changes by year
Meaning:
7.838 bln
Minimum:
150.0 mln
jan 1, 1991
Maximum:
43.355 bln
jan 1, 2014
At the date of observation
Value
Absolute change
Change from the previous value
jan 1, 1991
150.0 mln
+150.0 mln
0.0%
jan 1, 1992
552.875 mln
+402.875 mln
268.58%
jan 1, 1993
2.766 bln
+2.213 bln
400.3%
jan 1, 1994
5.861 bln
+3.094 bln
111.88%
jan 1, 1995
3.657 bln
-2.203 bln
-37.59%
jan 1, 1996
843.2 mln
-2.814 bln
-76.94%
jan 1, 1997
2.433 bln
+1.59 bln
188.54%
jan 1, 1998
3.69 bln
+1.257 bln
51.66%
jan 1, 1999
4.998 bln
+1.308 bln
35.46%
jan 1, 2000
5.875 bln
+876.864 mln
17.54%
jan 1, 2001
3.346 bln
-2.529 bln
-43.05%
jan 1, 2002
1.685 bln
-1.661 bln
-49.64%
jan 1, 2003
2.503 bln
+818.321 mln
48.56%
jan 1, 2004
2.505 bln
+1.26 mln
0.05%
jan 1, 2005
3.922 bln
+1.417 bln
56.58%
jan 1, 2006
6.669 bln
+2.747 bln
70.03%
jan 1, 2007
4.506 bln
-2.162 bln
-32.42%
jan 1, 2008
5.826 bln
+1.32 bln
29.28%
jan 1, 2009
931.0 mln
-4.895 bln
-84.02%
jan 1, 2010
5.067 bln
+4.136 bln
444.25%
jan 1, 2011
11.298 bln
+6.231 bln
122.97%
jan 1, 2012
18.065 bln
+6.767 bln
59.89%
jan 1, 2013
31.005 bln
+12.94 bln
71.63%
jan 1, 2014
43.355 bln
+12.35 bln
39.83%
jan 1, 2015
17.759 bln
-25.596 bln
-59.04%
jan 1, 2016
14.519 bln
-3.24 bln
-18.25%
Ranking of countries by current statistics by years
About & Feedback
Terms
Privacy
FAQ
Support 24/7
Cabinet
Get premium
Donate
The service accepts bank transfer (ACH, Wire) or cards (Visa, MasterCard, etc). Processed by Stripe.
Secured with SSL