Download This statistics in other country:
Timeline:
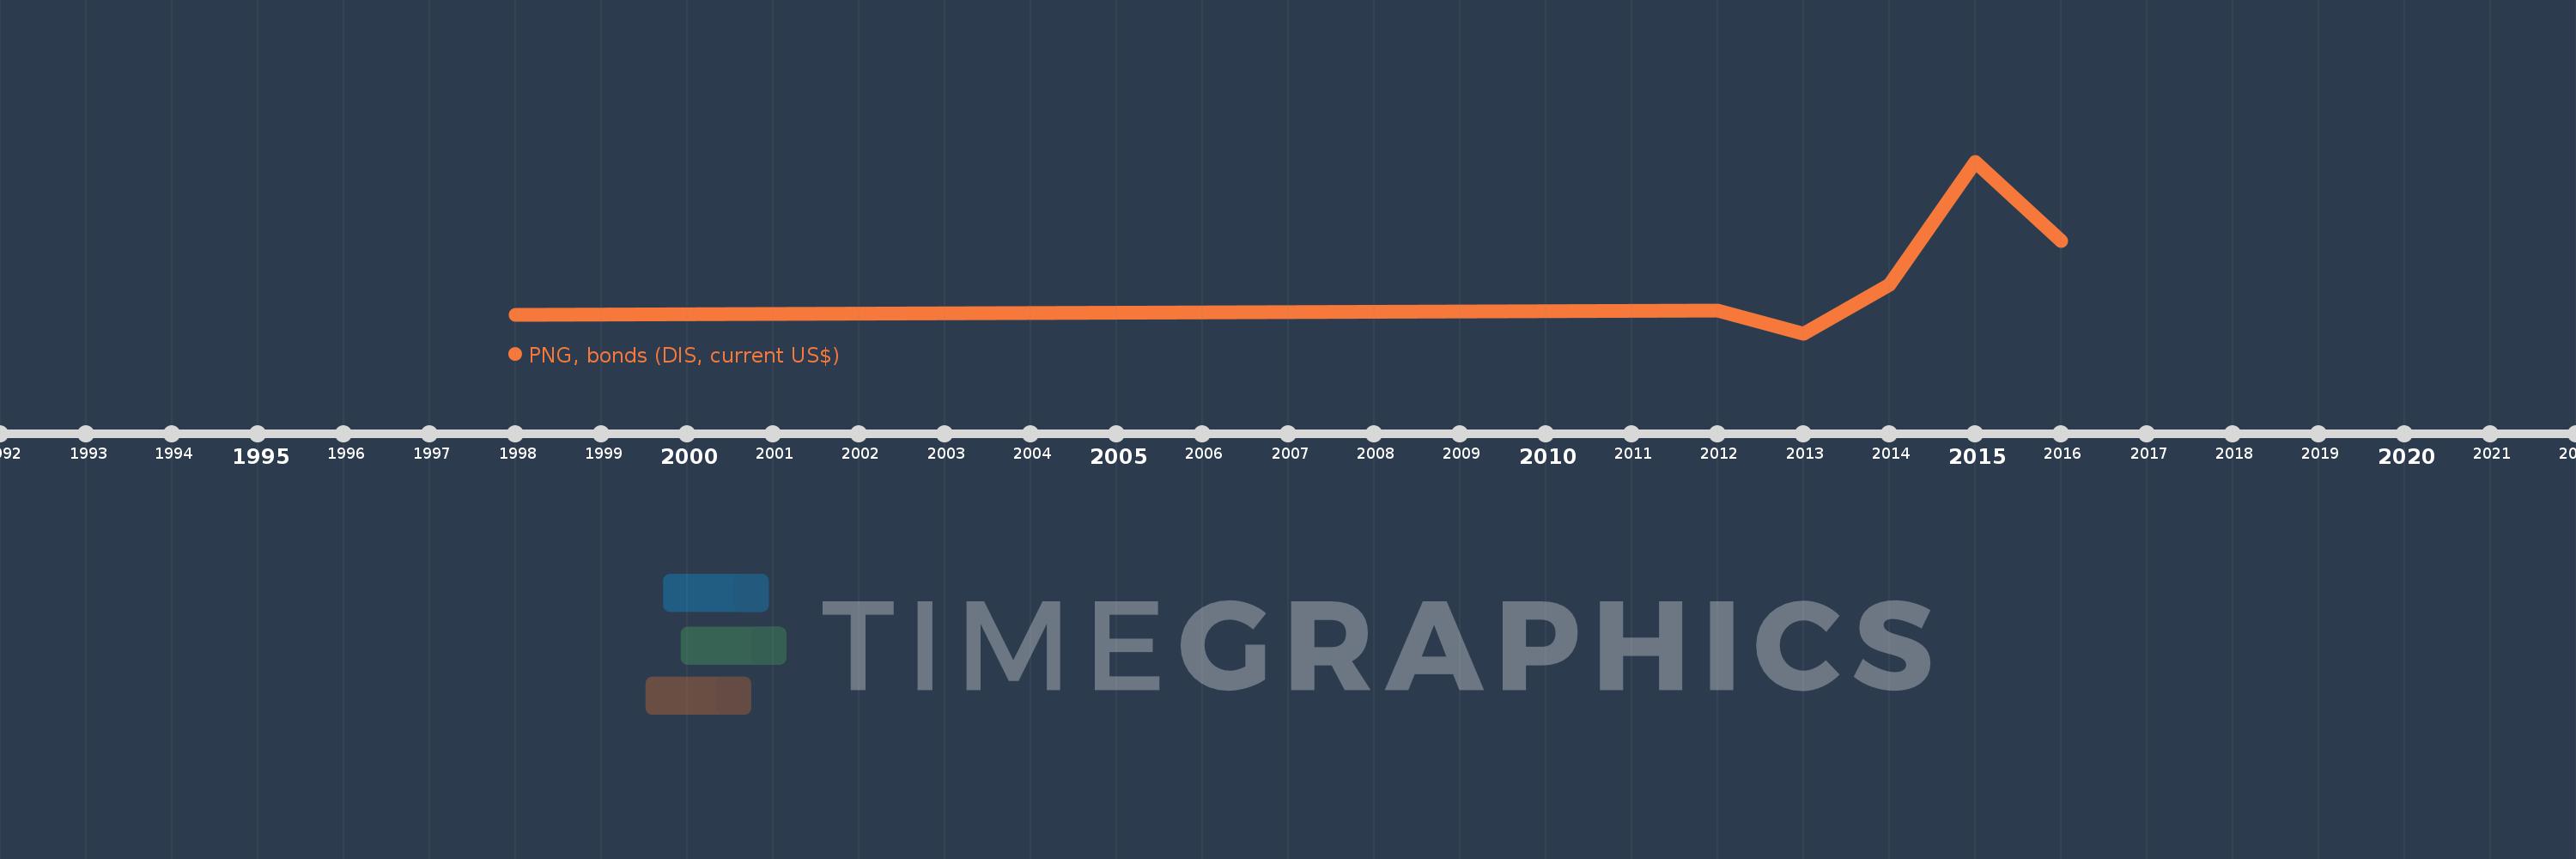
This timeline shows a graph from 1998 to 2016 of Romania. No data until 1997. Number of actual observations by date: 6.
Source name:
World Development Indicators
Source organization:
World Bank, International Debt Statistics.
Categories, topics:
External Debt
Last updated:
apr 23, 2017
Indicators value changes by year
Minimum:
37.902 mln
jan 1, 2013
Maximum:
381.522 mln
jan 1, 2015
At the date of observation
Value
Absolute change
Change from the previous value
jan 1, 1998
75.0 mln
+75.0 mln
0.0%
jan 1, 2012
82.931 mln
+7.931 mln
10.57%
jan 1, 2013
37.902 mln
-45.029 mln
-54.3%
jan 1, 2014
134.645 mln
+96.743 mln
255.25%
jan 1, 2015
381.522 mln
+246.877 mln
183.35%
jan 1, 2016
222.156 mln
-159.366 mln
-41.77%
Ranking of countries by current statistics by years