Download This statistics in other country:
Timeline:
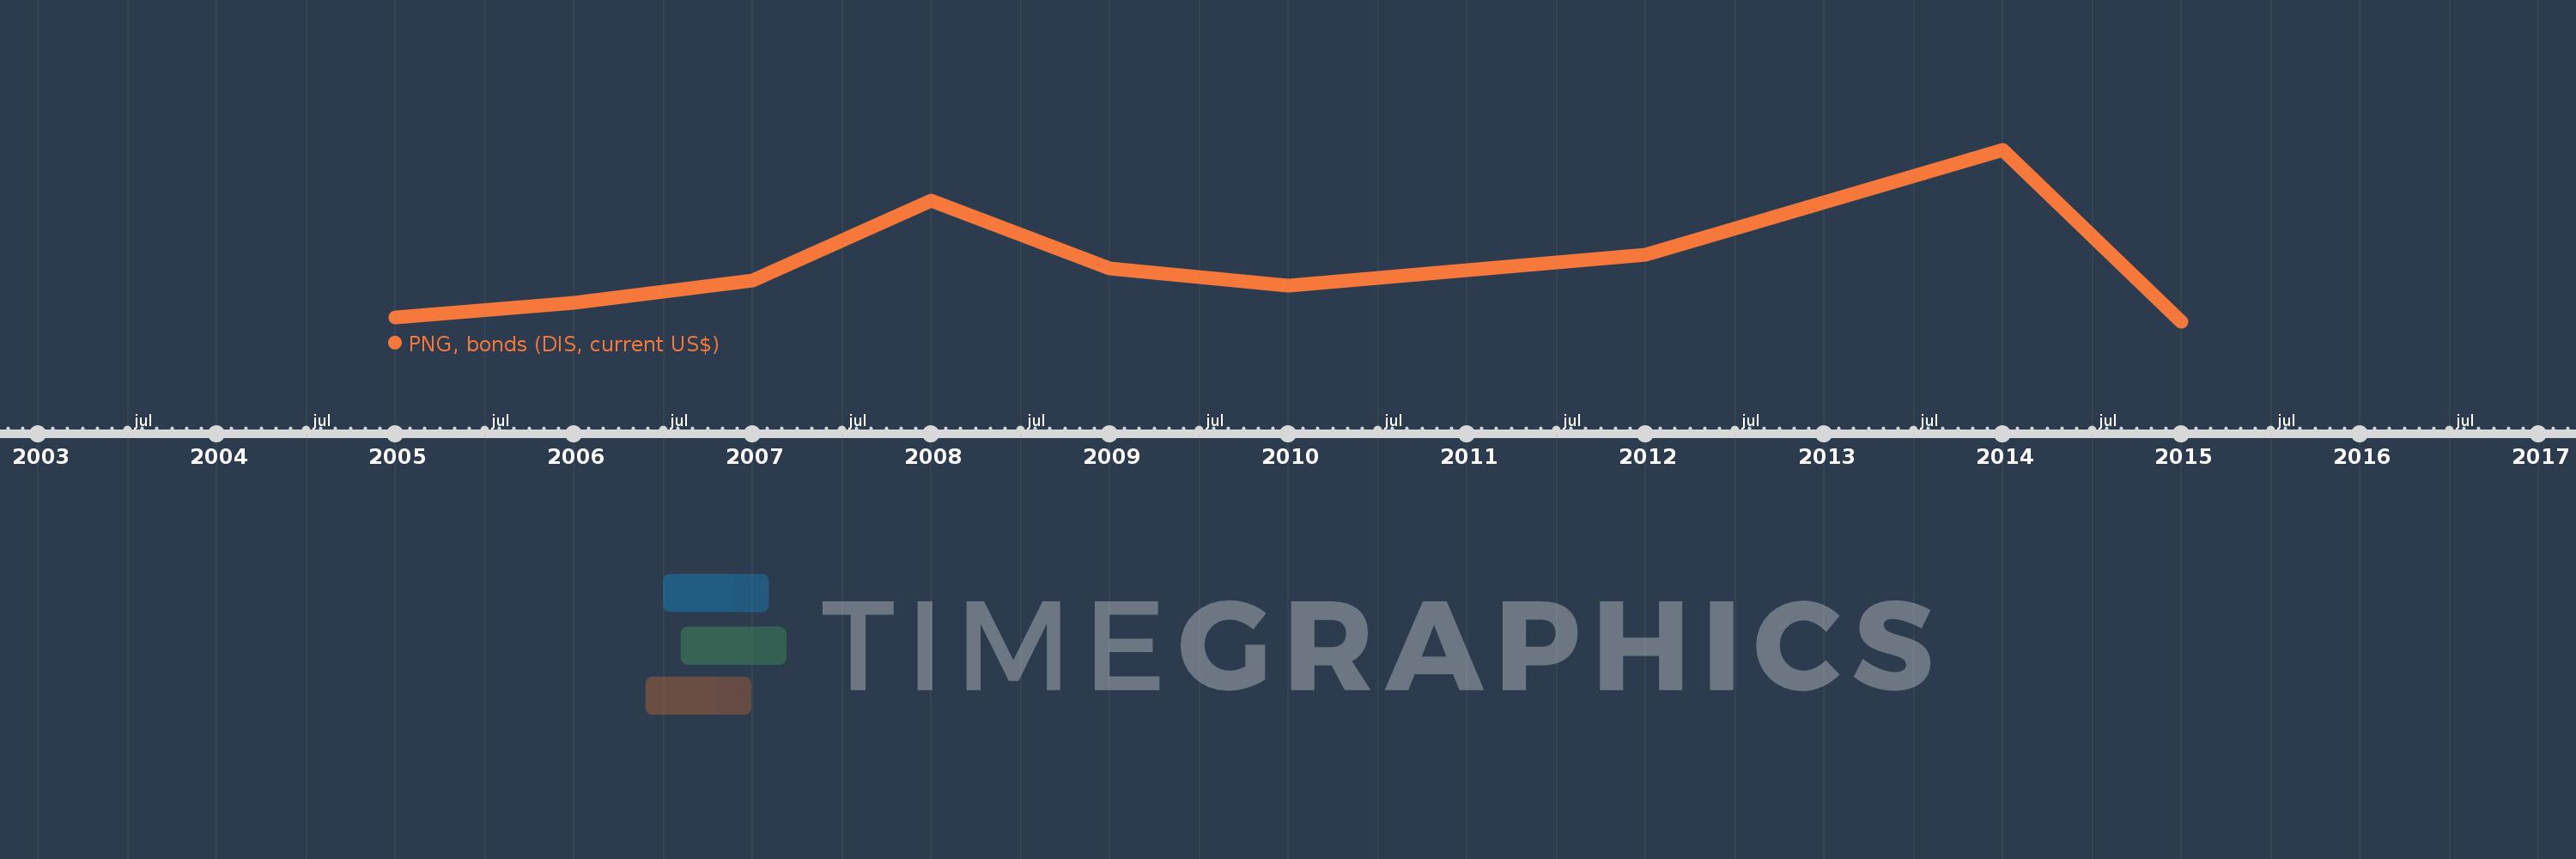
This timeline shows a graph from 2005 to 2015 of Ukraine. No data until 2004. Number of actual observations by date: 9.
Source name:
World Development Indicators
Source organization:
World Bank, International Debt Statistics.
Categories, topics:
External Debt
Last updated:
apr 23, 2017
Indicators value changes by year
Maximum:
3.975 bln
jan 1, 2014
At the date of observation
Value
Absolute change
Change from the previous value
jan 1, 2005
100.0 mln
+100.0 mln
0.0%
jan 1, 2006
450.0 mln
+350.0 mln
350.0%
jan 1, 2007
962.077 mln
+512.077 mln
113.79%
jan 1, 2008
2.8 bln
+1.838 bln
191.04%
jan 1, 2009
1.23 bln
-1.57 bln
-56.07%
jan 1, 2010
845.731 mln
-384.269 mln
-31.24%
jan 1, 2012
1.55 bln
+704.269 mln
83.27%
jan 1, 2014
3.975 bln
+2.425 bln
156.45%
jan 1, 2015
0.0
-3.975 bln
-100.0%
Ranking of countries by current statistics by years