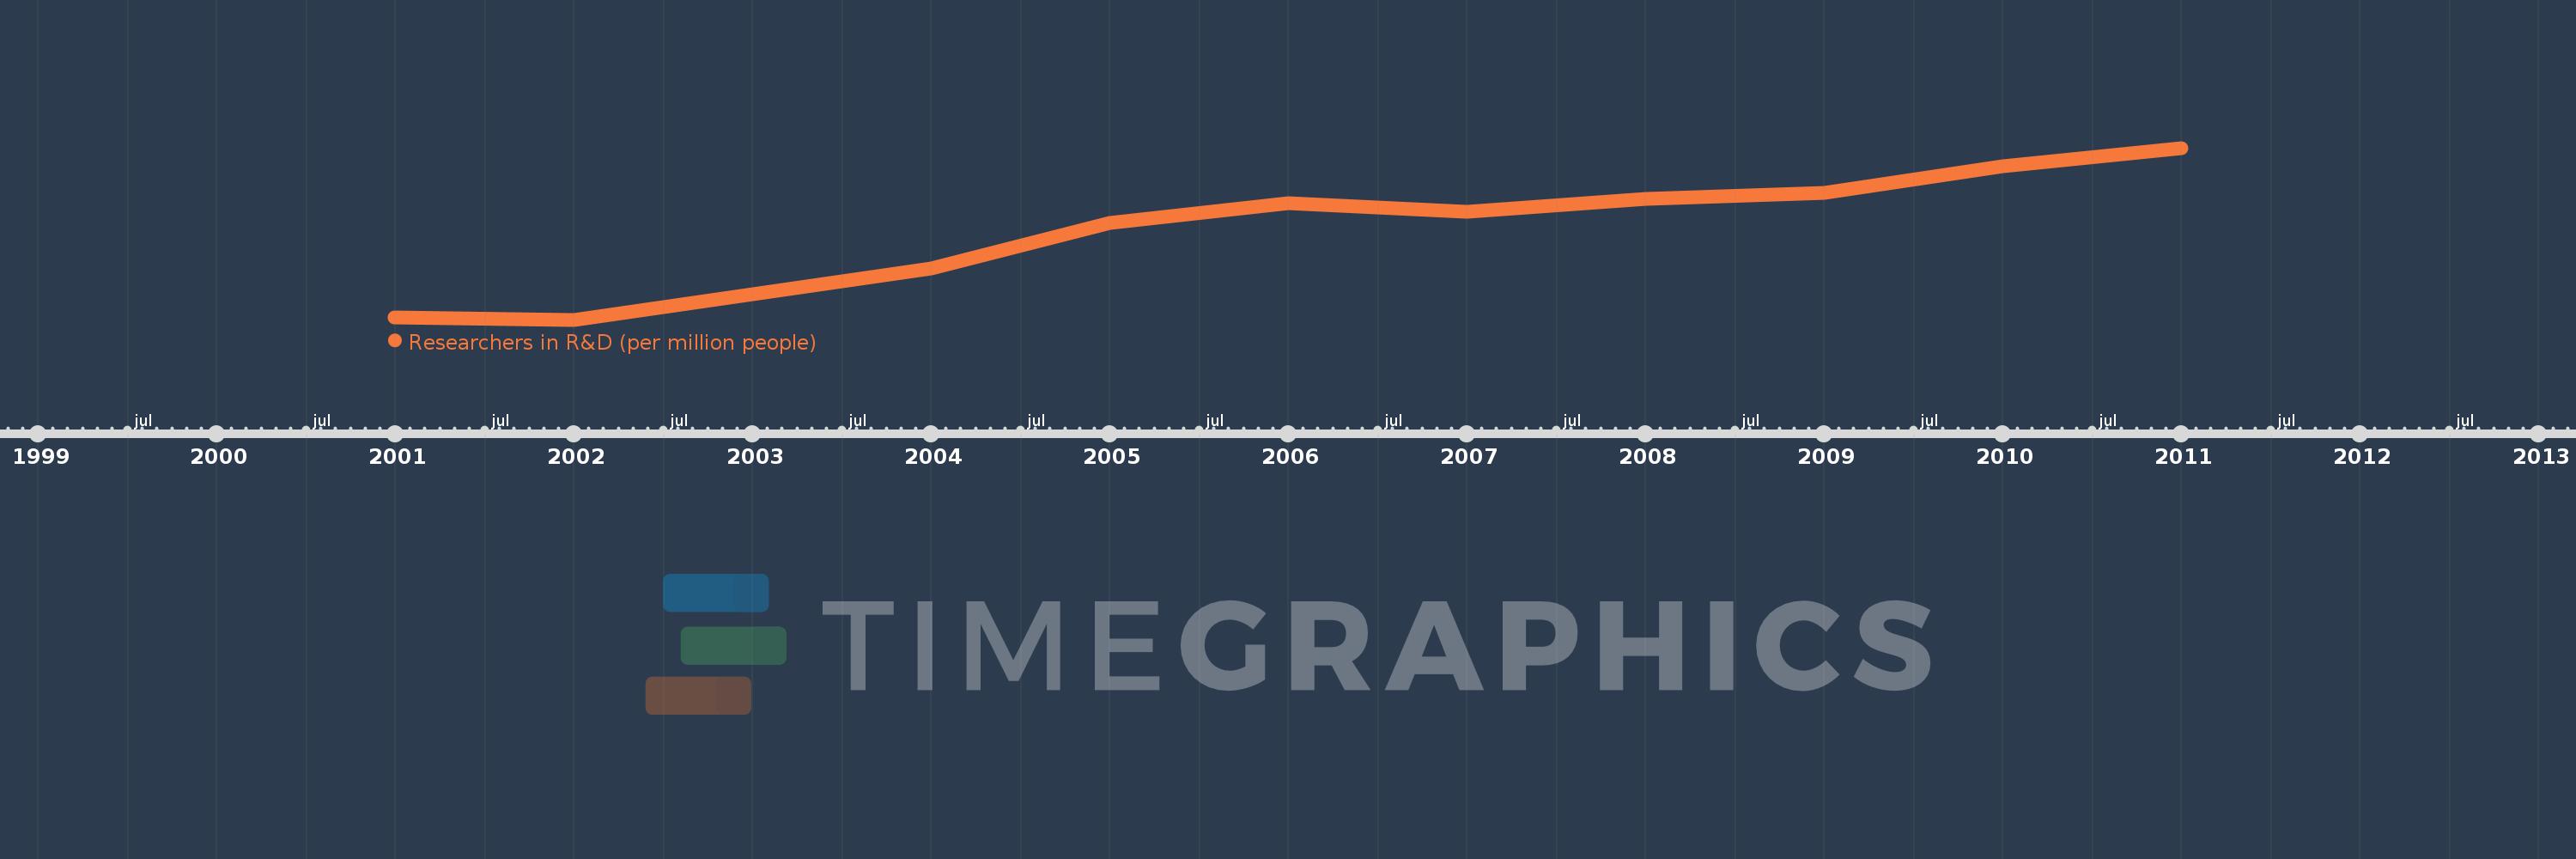
This timeline shows a graph from 2001 to 2011 of Latin America & the Caribbean (IDA & IBRD countries). No data until 2000. Number of actual observations by date: 11.
Source name:
World Development Indicators
Source organization:
United Nations Educational, Scientific, and Cultural Organization (UNESCO) Institute for Statistics.
Categories, topics:
Science & Technology
Last updated:
apr 23, 2017
Indicators value changes by year
Meaning:
420.396
Minimum:
326.065
jan 1, 2002
Maximum:
509.194
jan 1, 2011
At the date of observation
Value
Absolute change
Change from the previous value
jan 1, 2001
328.511
+328.511
0.0%
jan 1, 2002
326.065
-2.446
-0.74%
jan 1, 2003
352.937
+26.872
8.24%
jan 1, 2004
380.985
+28.048
7.95%
jan 1, 2005
428.922
+47.937
12.58%
jan 1, 2006
450.691
+21.769
5.08%
jan 1, 2007
440.821
-9.87
-2.19%
jan 1, 2008
455.211
+14.389
3.26%
jan 1, 2009
460.916
+5.706
1.25%
jan 1, 2010
490.104
+29.187
6.33%
jan 1, 2011
509.194
+19.09
3.9%
Ranking of countries by current statistics by years