Download This statistics in other country:
Timeline:
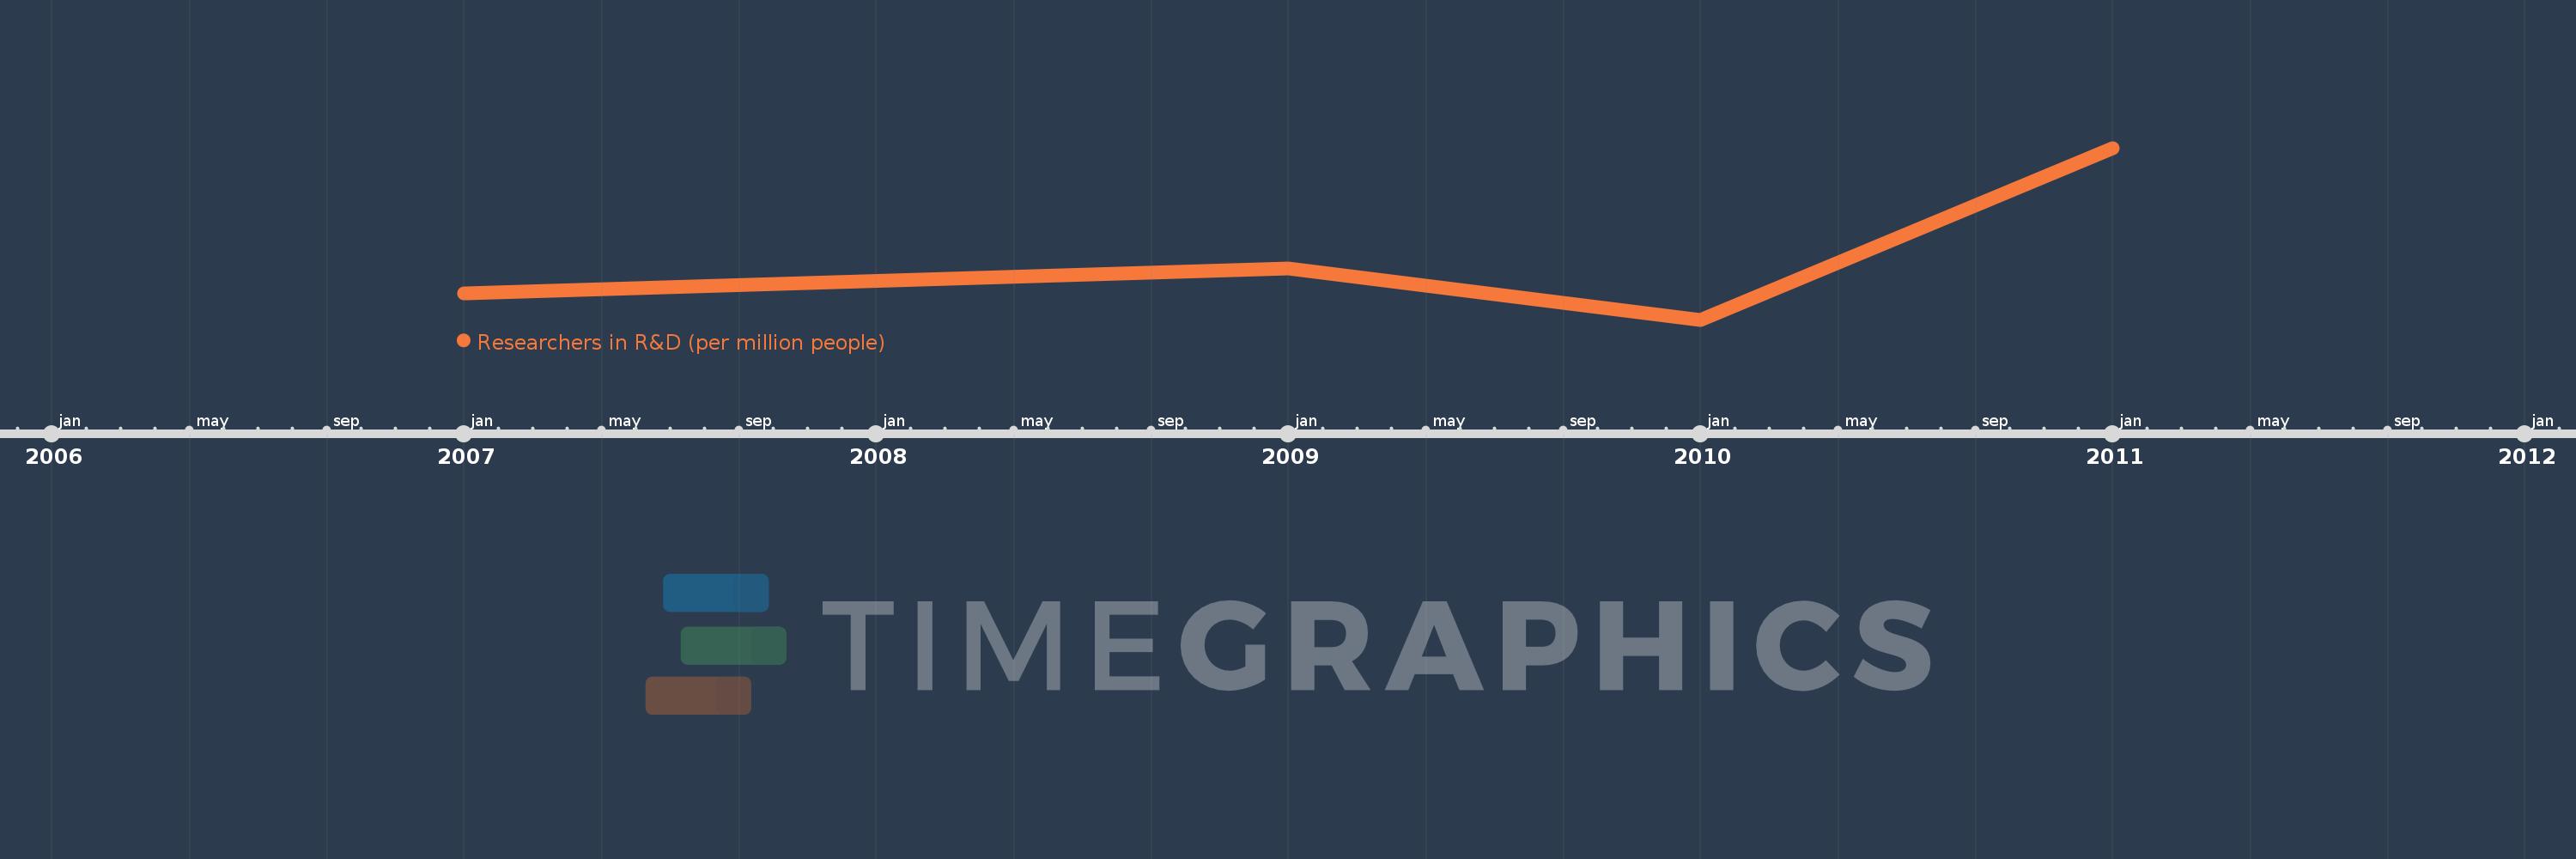
This timeline shows a graph from 2007 to 2011 of Mozambique. No data until 2006. Number of actual observations by date: 4.
Source name:
World Development Indicators
Source organization:
United Nations Educational, Scientific, and Cultural Organization (UNESCO) Institute for Statistics.
Categories, topics:
Science & Technology
Last updated:
apr 23, 2017
Indicators value changes by year
Minimum:
11.527
jan 1, 2010
Maximum:
37.512
jan 1, 2011
At the date of observation
Value
Absolute change
Change from the previous value
jan 1, 2007
15.503
+15.503
0.0%
jan 1, 2009
19.3
+3.797
24.49%
jan 1, 2010
11.527
-7.773
-40.28%
jan 1, 2011
37.512
+25.985
225.43%
Ranking of countries by current statistics by years