33
/
AIzaSyB4mHJ5NPEv-XzF7P6NDYXjlkCWaeKw5bc
November 30, 2025
270018
Turkey
TUR
true
2
1
Researchers in R&D (per million people)
2015,2014,2013,2012,2011,2010,2009,2008,2007,2006,2005,2004,2003,2002,2001,2000,1999,1998,1997
Create a timeline
Public Timelines
For education
For educational institutions
For teachers
For students
Cabinet
For educational institutions
For teachers
For students
Open cabinet
FAQ
Close
Create a timeline
Public timelines
FAQ
About & Feedback
Terms
Privacy
FAQ
Support 24/7
Cabinet
Get premium
Donate
Download
Global statistics library
→
Turkey
→
Researchers in R&D (per million people)
This statistics in other country:
Albania
Algeria
American Samoa
Angola
Argentina
Australia
Austria
Bahrain
Belgium
Bolivia
Bosnia and Herzegovina
Botswana
Brazil
Brunei Darussalam
Bulgaria
Burkina Faso
Cabo Verde
Cambodia
Canada
Central Europe and the Baltics
Chile
China
Colombia
Congo, Rep.
Costa Rica
Cote d'Ivoire
Croatia
Cyprus
Czech Republic
Denmark
Early-demographic dividend
East Asia & Pacific
East Asia & Pacific (excluding high income)
East Asia & Pacific (IDA & IBRD countries)
Ecuador
Egypt, Arab Rep.
Estonia
Ethiopia
Euro area
Europe & Central Asia
Europe & Central Asia (excluding high income)
Europe & Central Asia (IDA & IBRD countries)
European Union
Faroe Islands
Finland
France
Gambia, The
Georgia
Germany
Ghana
Greece
Greenland
Guam
Guatemala
High income
Hong Kong SAR, China
Hungary
IBRD only
Iceland
IDA & IBRD total
India
Indonesia
Iran, Islamic Rep.
Iraq
Ireland
Israel
Italy
Japan
Jordan
Kazakhstan
Kenya
Korea, Rep.
Kuwait
Lao PDR
Late-demographic dividend
Latin America & Caribbean
Latin America & Caribbean (excluding high income)
Latin America & the Caribbean (IDA & IBRD countries)
Latvia
Lesotho
Lithuania
Low & middle income
Luxembourg
Macao SAR, China
Macedonia, FYR
Madagascar
Malawi
Malaysia
Mali
Malta
Mauritius
Mexico
Middle East & North Africa (excluding high income)
Middle East & North Africa (IDA & IBRD countries)
Middle income
Moldova
Montenegro
Morocco
Mozambique
Myanmar
Nepal
Netherlands
New Zealand
Nicaragua
Niger
Nigeria
North America
Norway
OECD members
Oman
Pakistan
Panama
Paraguay
Philippines
Poland
Portugal
Post-demographic dividend
Puerto Rico
Qatar
Romania
Russian Federation
Rwanda
Senegal
Serbia
Seychelles
Singapore
Slovak Republic
Slovenia
South Africa
South Asia
South Asia (IDA & IBRD)
Spain
Sri Lanka
Sweden
Switzerland
Tanzania
Thailand
Togo
Tunisia
Turkey
Uganda
Ukraine
United Kingdom
United States
Upper middle income
Uruguay
Uzbekistan
Venezuela, RB
Vietnam
West Bank and Gaza
World
Zambia
Zimbabwe
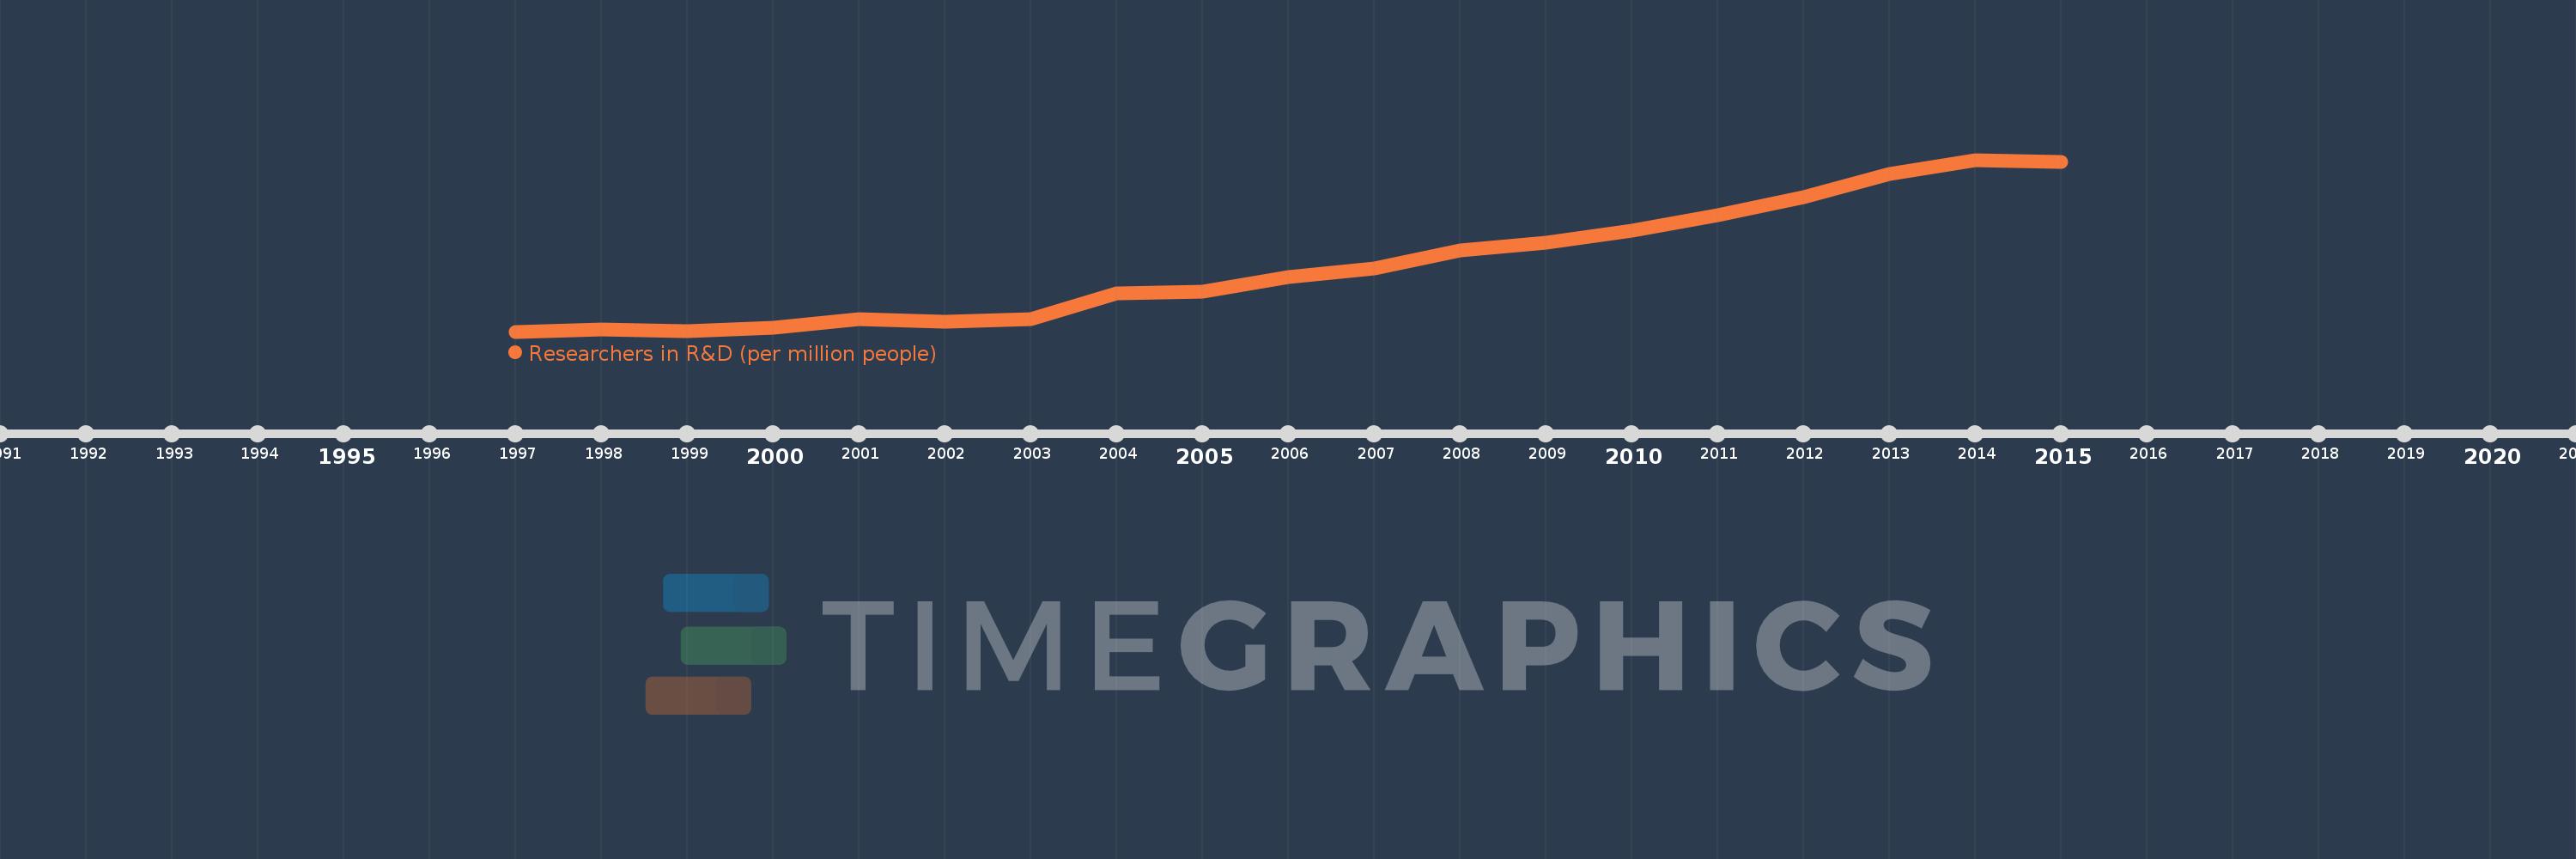
Timeline:
This timeline shows a graph from
1997
to
2015
of Turkey. No data until
1996
. Number of actual observations by date:
19
.
Source name:
World Development Indicators
Source organization:
United Nations Educational, Scientific, and Cultural Organization (UNESCO) Institute for Statistics.
Categories, topics:
Science & Technology
Last updated:
apr 23, 2017
Indicators value changes by year
Meaning:
636.928
Minimum:
304.198
jan 1, 1997
Maximum:
1.169K
jan 1, 2014
At the date of observation
Value
Absolute change
Change from the previous value
jan 1, 1997
304.198
+304.198
0.0%
jan 1, 1998
313.077
+8.879
2.92%
jan 1, 1999
308.502
-4.575
-1.46%
jan 1, 2000
322.093
+13.592
4.41%
jan 1, 2001
365.005
+42.912
13.32%
jan 1, 2002
353.709
-11.296
-3.09%
jan 1, 2003
368.441
+14.732
4.16%
jan 1, 2004
494.398
+125.957
34.19%
jan 1, 2005
505.82
+11.422
2.31%
jan 1, 2006
576.755
+70.936
14.02%
jan 1, 2007
620.969
+44.213
7.67%
jan 1, 2008
714.486
+93.518
15.06%
jan 1, 2009
750.748
+36.261
5.08%
jan 1, 2010
810.518
+59.77
7.96%
jan 1, 2011
889.788
+79.27
9.78%
jan 1, 2012
980.842
+91.054
10.23%
jan 1, 2013
1.097K
+116.33
11.86%
jan 1, 2014
1.169K
+71.427
6.51%
jan 1, 2015
1.157K
-12.086
-1.03%
Ranking of countries by current statistics by years
About & Feedback
Terms
Privacy
FAQ
Support 24/7
Cabinet
Get premium
Donate
The service accepts bank transfer (ACH, Wire) or cards (Visa, MasterCard, etc). Processed by Stripe.
Secured with SSL