Download This statistics in other country:
Timeline:
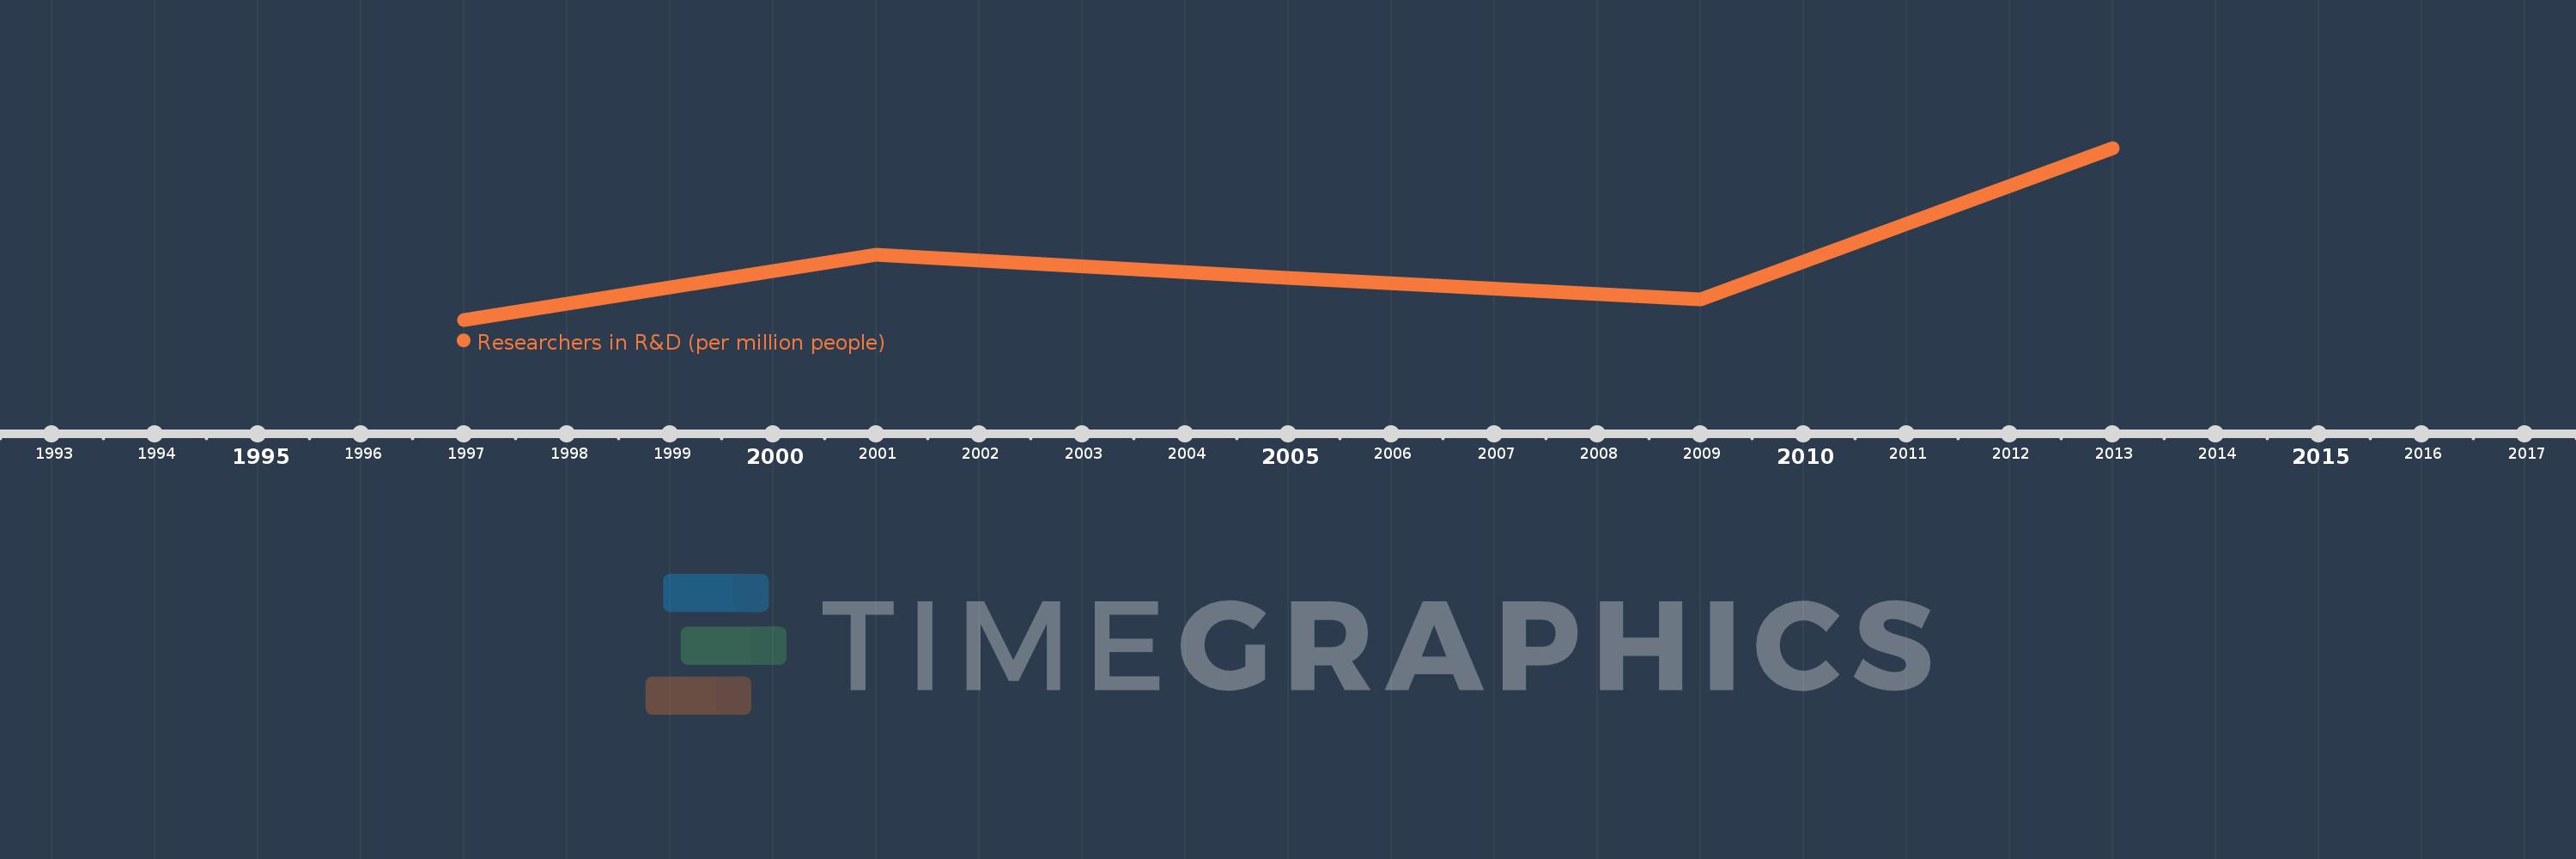
This timeline shows a graph from 1997 to 2013 of Switzerland. No data until 1996. Number of actual observations by date: 5.
Source name:
World Development Indicators
Source organization:
United Nations Educational, Scientific, and Cultural Organization (UNESCO) Institute for Statistics.
Categories, topics:
Science & Technology
Last updated:
apr 23, 2017
Indicators value changes by year
Minimum:
3.131K
jan 1, 1997
Maximum:
4.481K
jan 1, 2013
At the date of observation
Value
Absolute change
Change from the previous value
jan 1, 1997
3.131K
+3.131K
0.0%
jan 1, 2001
3.643K
+511.927
16.35%
jan 1, 2005
3.458K
-185.116
-5.08%
jan 1, 2009
3.288K
-170.011
-4.92%
jan 1, 2013
4.481K
+1.193K
36.29%
Ranking of countries by current statistics by years