Download This statistics in other country:
Timeline:
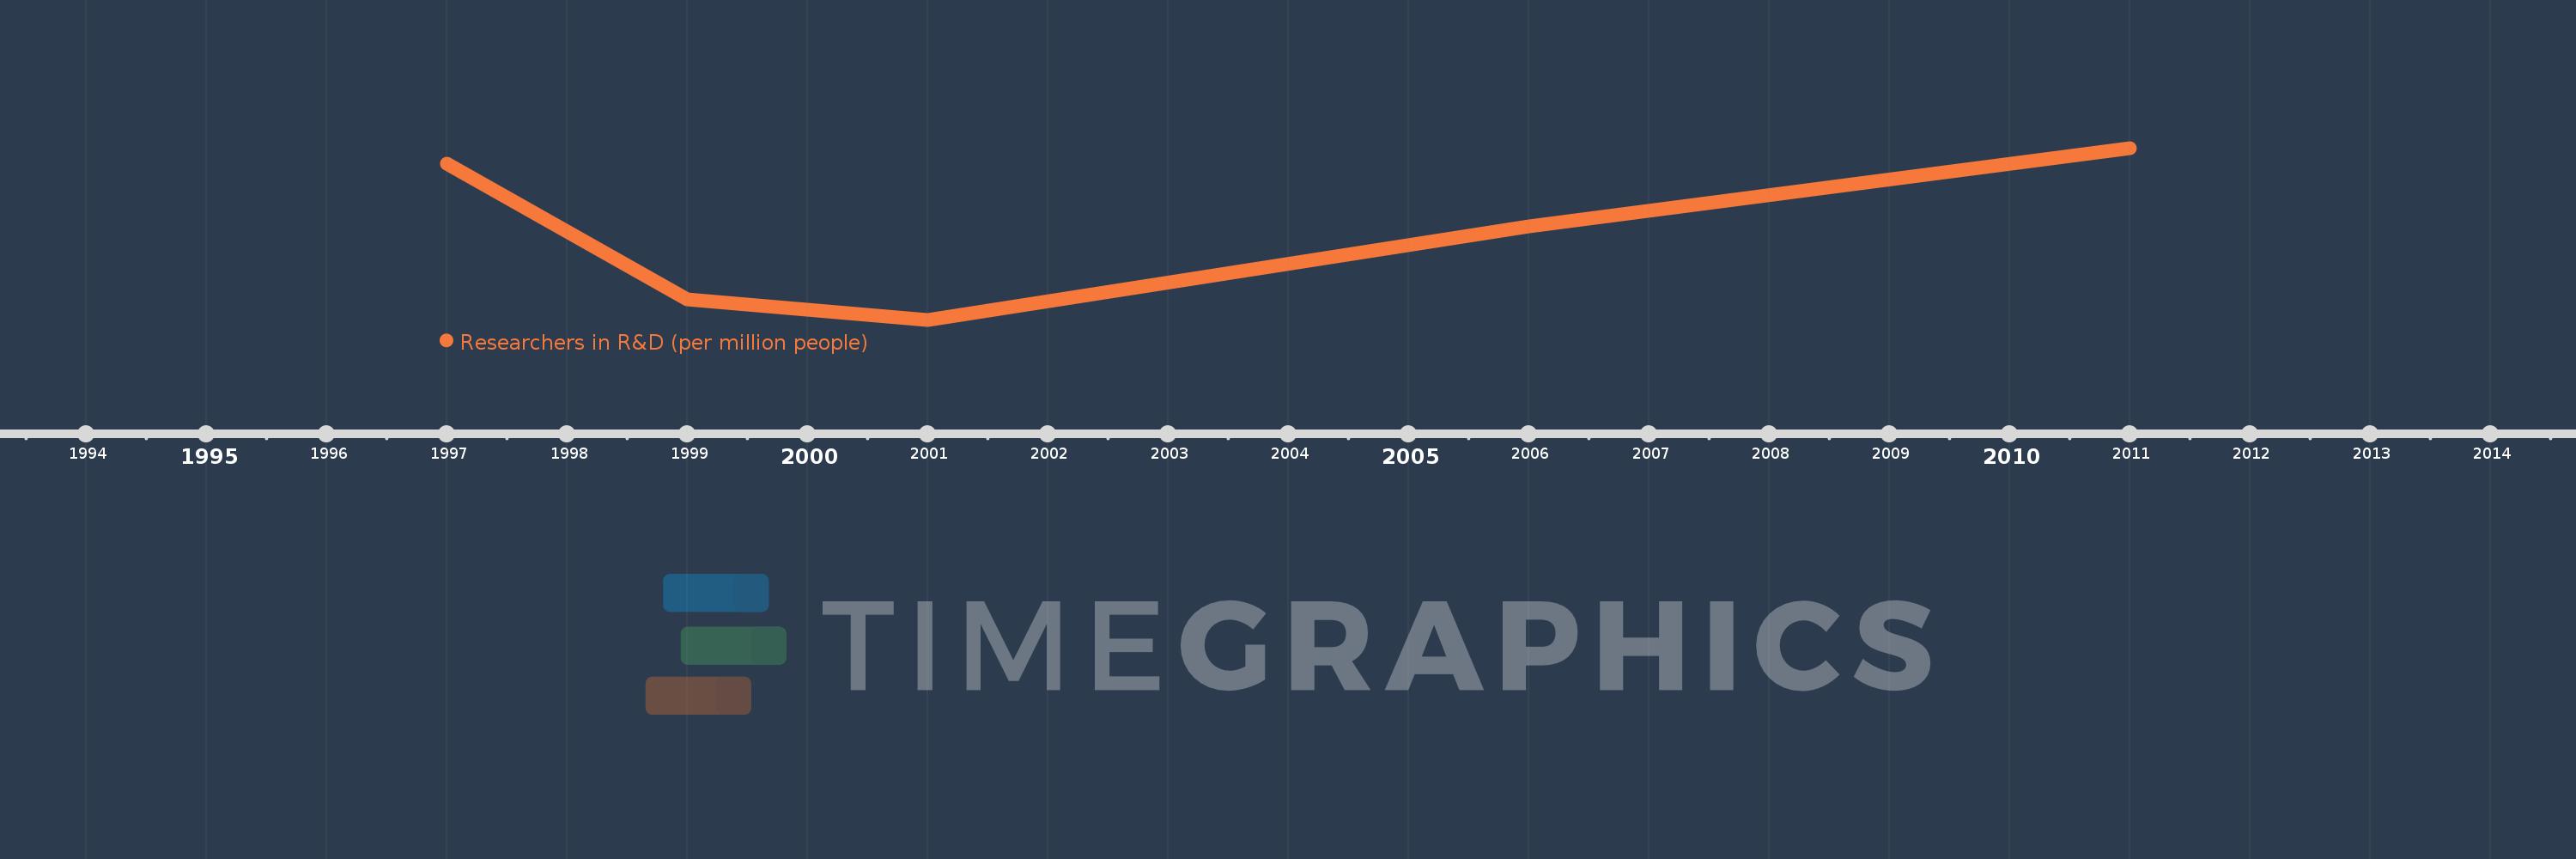
This timeline shows a graph from 1997 to 2011 of India. No data until 1996. Number of actual observations by date: 5.
Source name:
World Development Indicators
Source organization:
United Nations Educational, Scientific, and Cultural Organization (UNESCO) Institute for Statistics.
Categories, topics:
Science & Technology
Last updated:
apr 23, 2017
Indicators value changes by year
Minimum:
110.05
jan 1, 2001
Maximum:
156.638
jan 1, 2011
At the date of observation
Value
Absolute change
Change from the previous value
jan 1, 1997
152.484
+152.484
0.0%
jan 1, 1999
115.631
-36.853
-24.17%
jan 1, 2001
110.05
-5.581
-4.83%
jan 1, 2006
135.3
+25.249
22.94%
jan 1, 2011
156.638
+21.338
15.77%
Ranking of countries by current statistics by years