Download This statistics in other country:
Timeline:
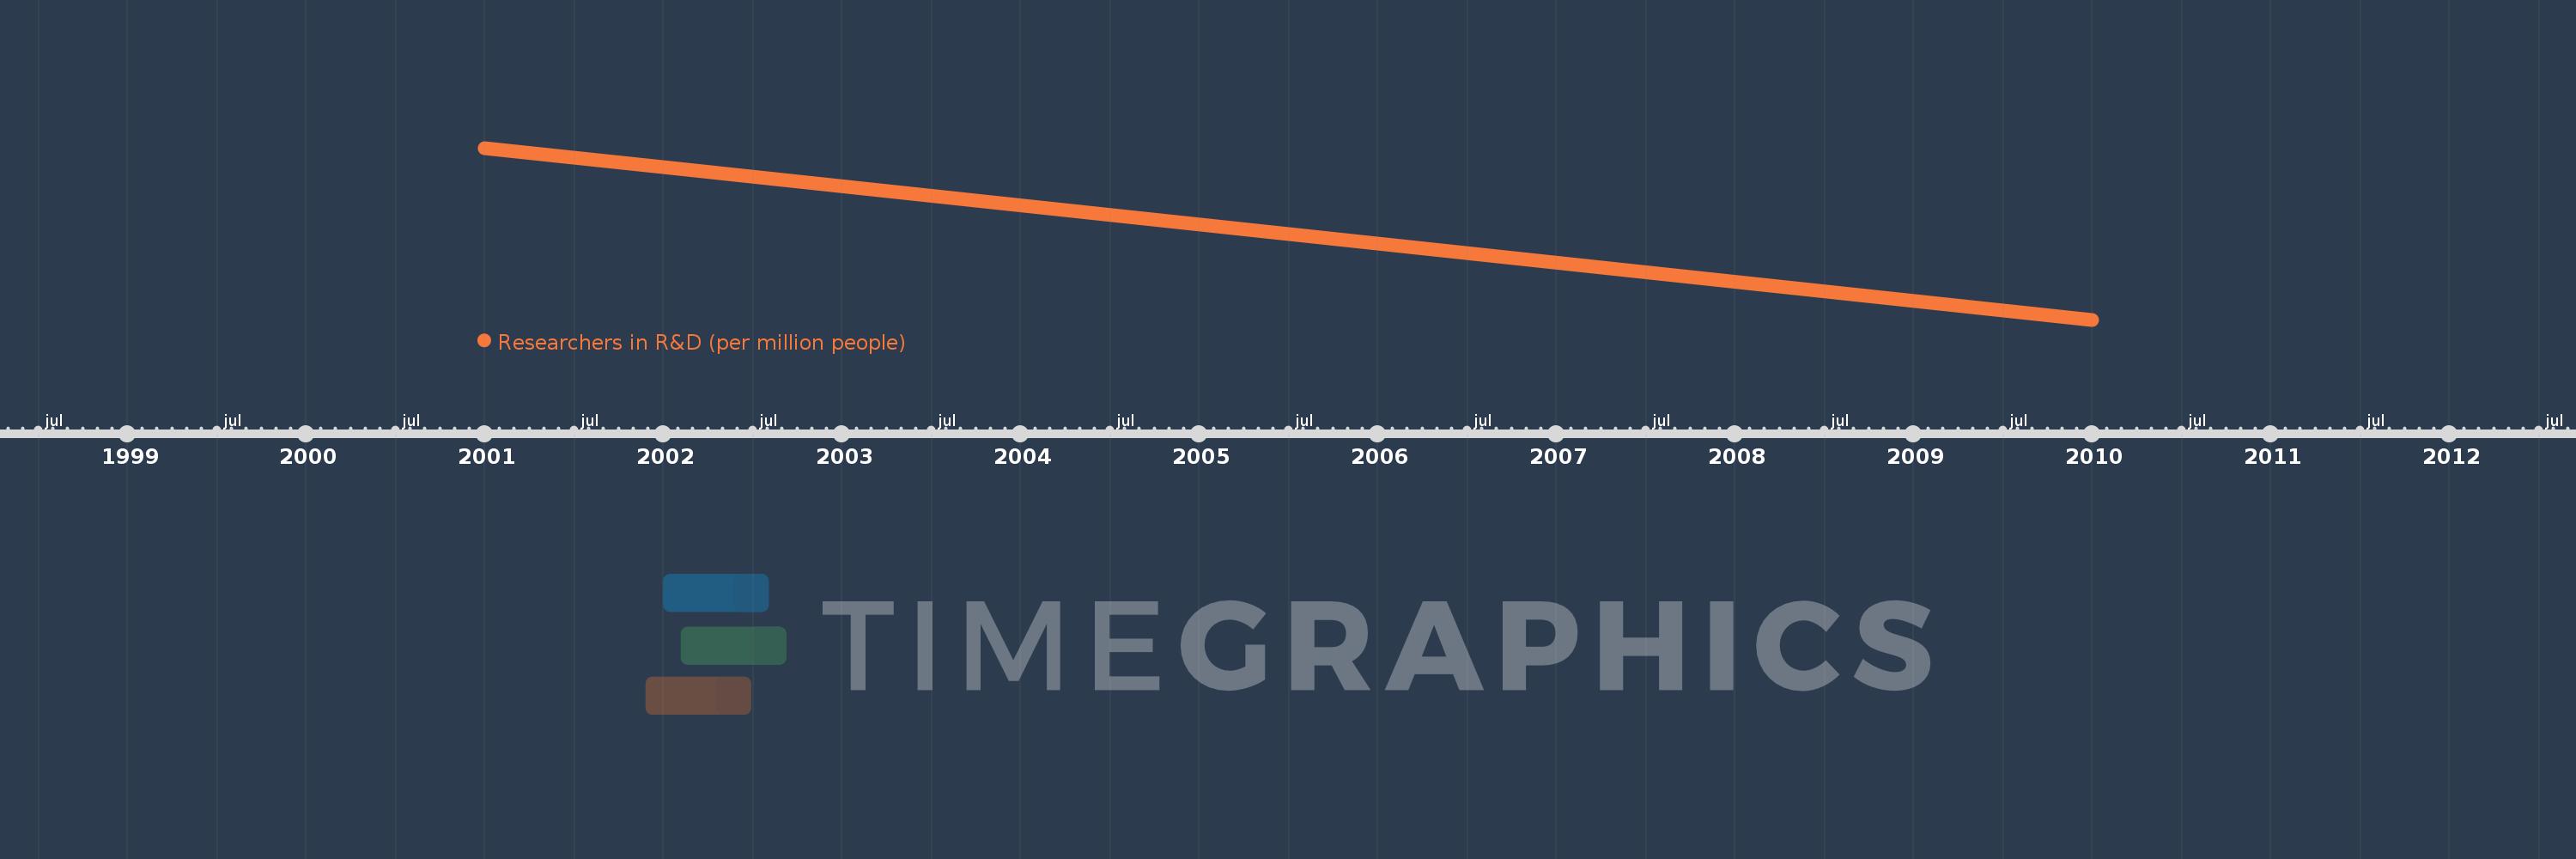
This timeline shows a graph from 2001 to 2010 of Indonesia. No data until 2000. Number of actual observations by date: 3.
Source name:
World Development Indicators
Source organization:
United Nations Educational, Scientific, and Cultural Organization (UNESCO) Institute for Statistics.
Categories, topics:
Science & Technology
Last updated:
apr 23, 2017
Indicators value changes by year
Minimum:
89.527
jan 1, 2010
Maximum:
212.65
jan 1, 2001
At the date of observation
Value
Absolute change
Change from the previous value
jan 1, 2001
212.65
+212.65
0.0%
jan 1, 2002
199.218
-13.431
-6.32%
jan 1, 2010
89.527
-109.691
-55.06%
Ranking of countries by current statistics by years