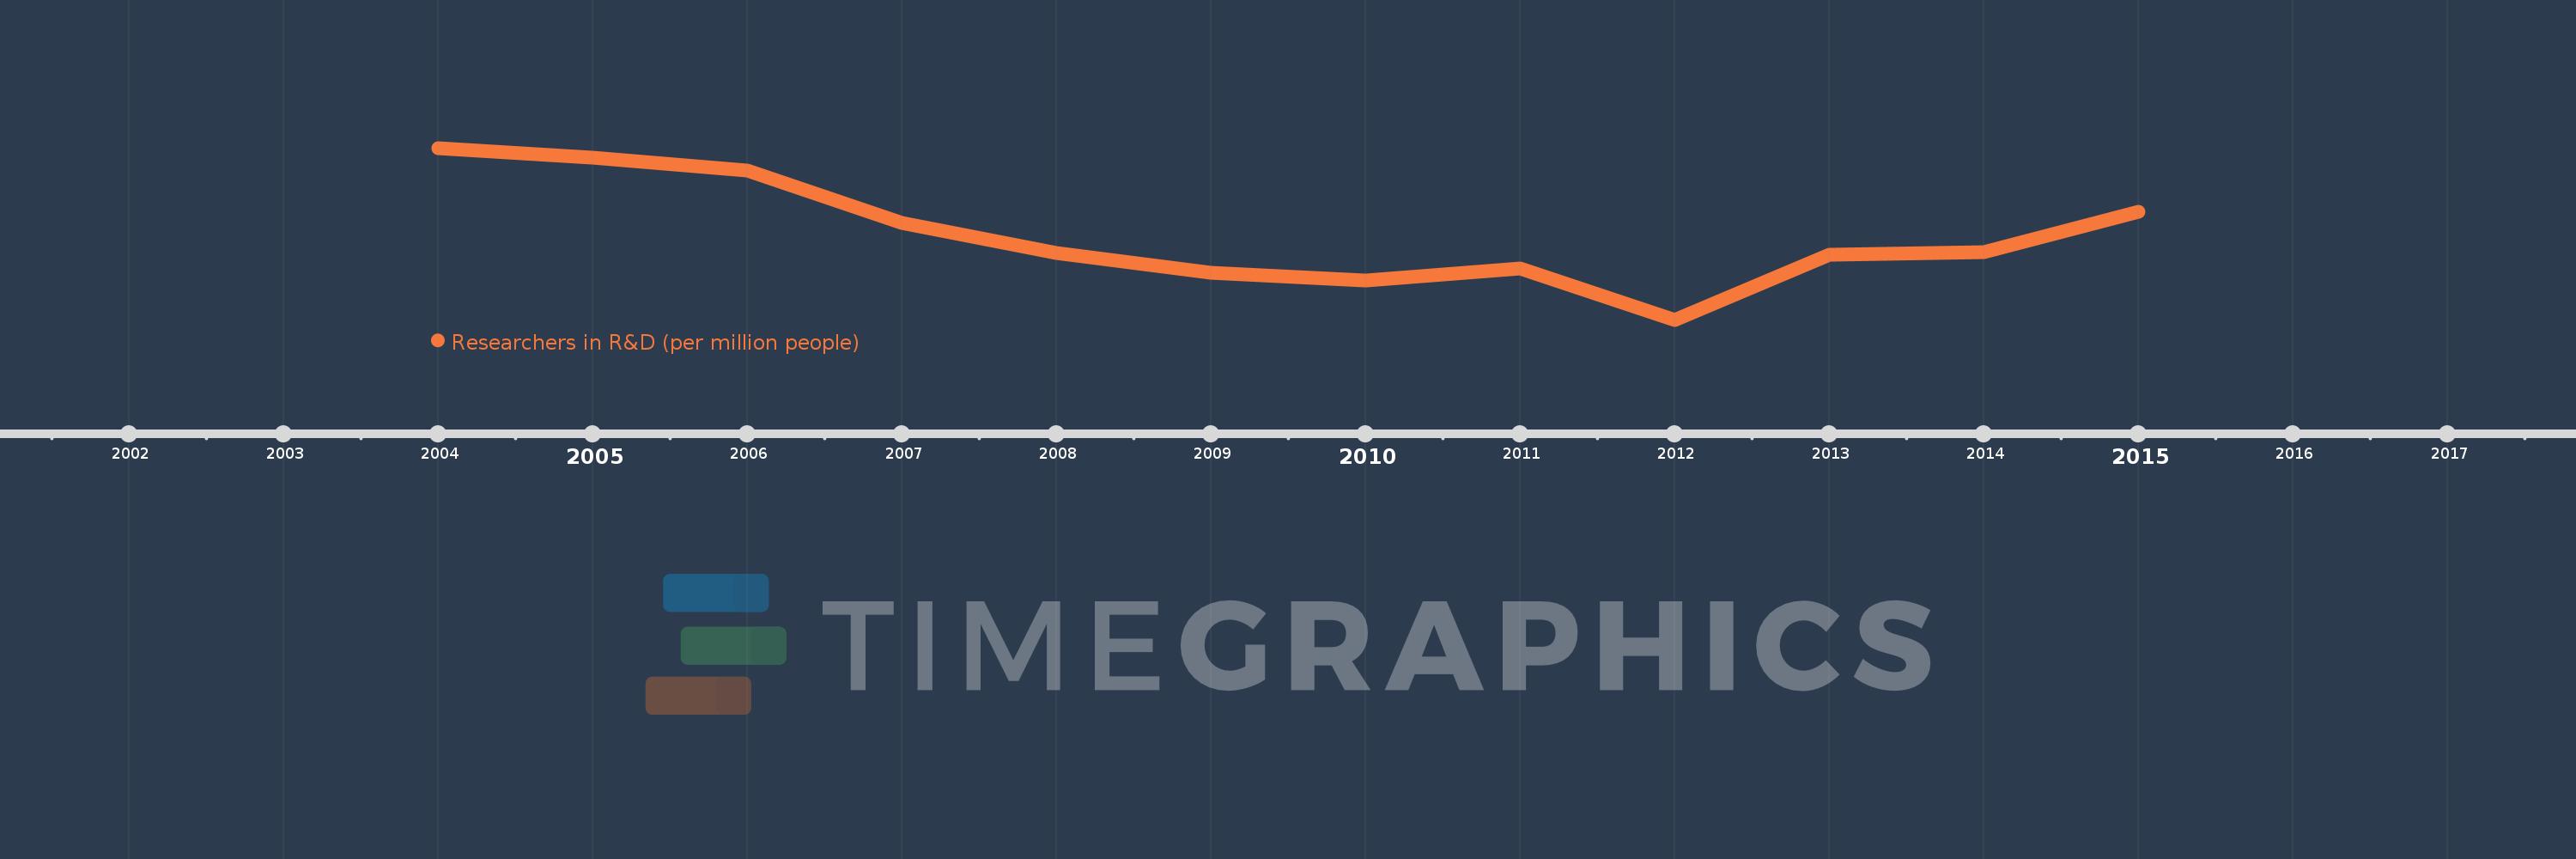
This timeline shows a graph from 2004 to 2015 of Europe & Central Asia (IDA & IBRD countries). No data until 2003. Number of actual observations by date: 12.
Source name:
World Development Indicators
Source organization:
United Nations Educational, Scientific, and Cultural Organization (UNESCO) Institute for Statistics.
Categories, topics:
Science & Technology
Last updated:
apr 23, 2017
Indicators value changes by year
Meaning:
1.964K
Minimum:
1.814K
jan 1, 2012
Maximum:
2.117K
jan 1, 2004
At the date of observation
Value
Absolute change
Change from the previous value
jan 1, 2004
2.117K
+2.117K
0.0%
jan 1, 2005
2.1K
-16.953
-0.8%
jan 1, 2006
2.077K
-23.509
-1.12%
jan 1, 2007
1.984K
-92.668
-4.46%
jan 1, 2008
1.932K
-51.842
-2.61%
jan 1, 2009
1.896K
-35.933
-1.86%
jan 1, 2010
1.883K
-12.785
-0.67%
jan 1, 2011
1.905K
+21.494
1.14%
jan 1, 2012
1.814K
-91.261
-4.79%
jan 1, 2013
1.929K
+115.192
6.35%
jan 1, 2014
1.933K
+3.689
0.19%
jan 1, 2015
2.004K
+71.489
3.7%
Ranking of countries by current statistics by years