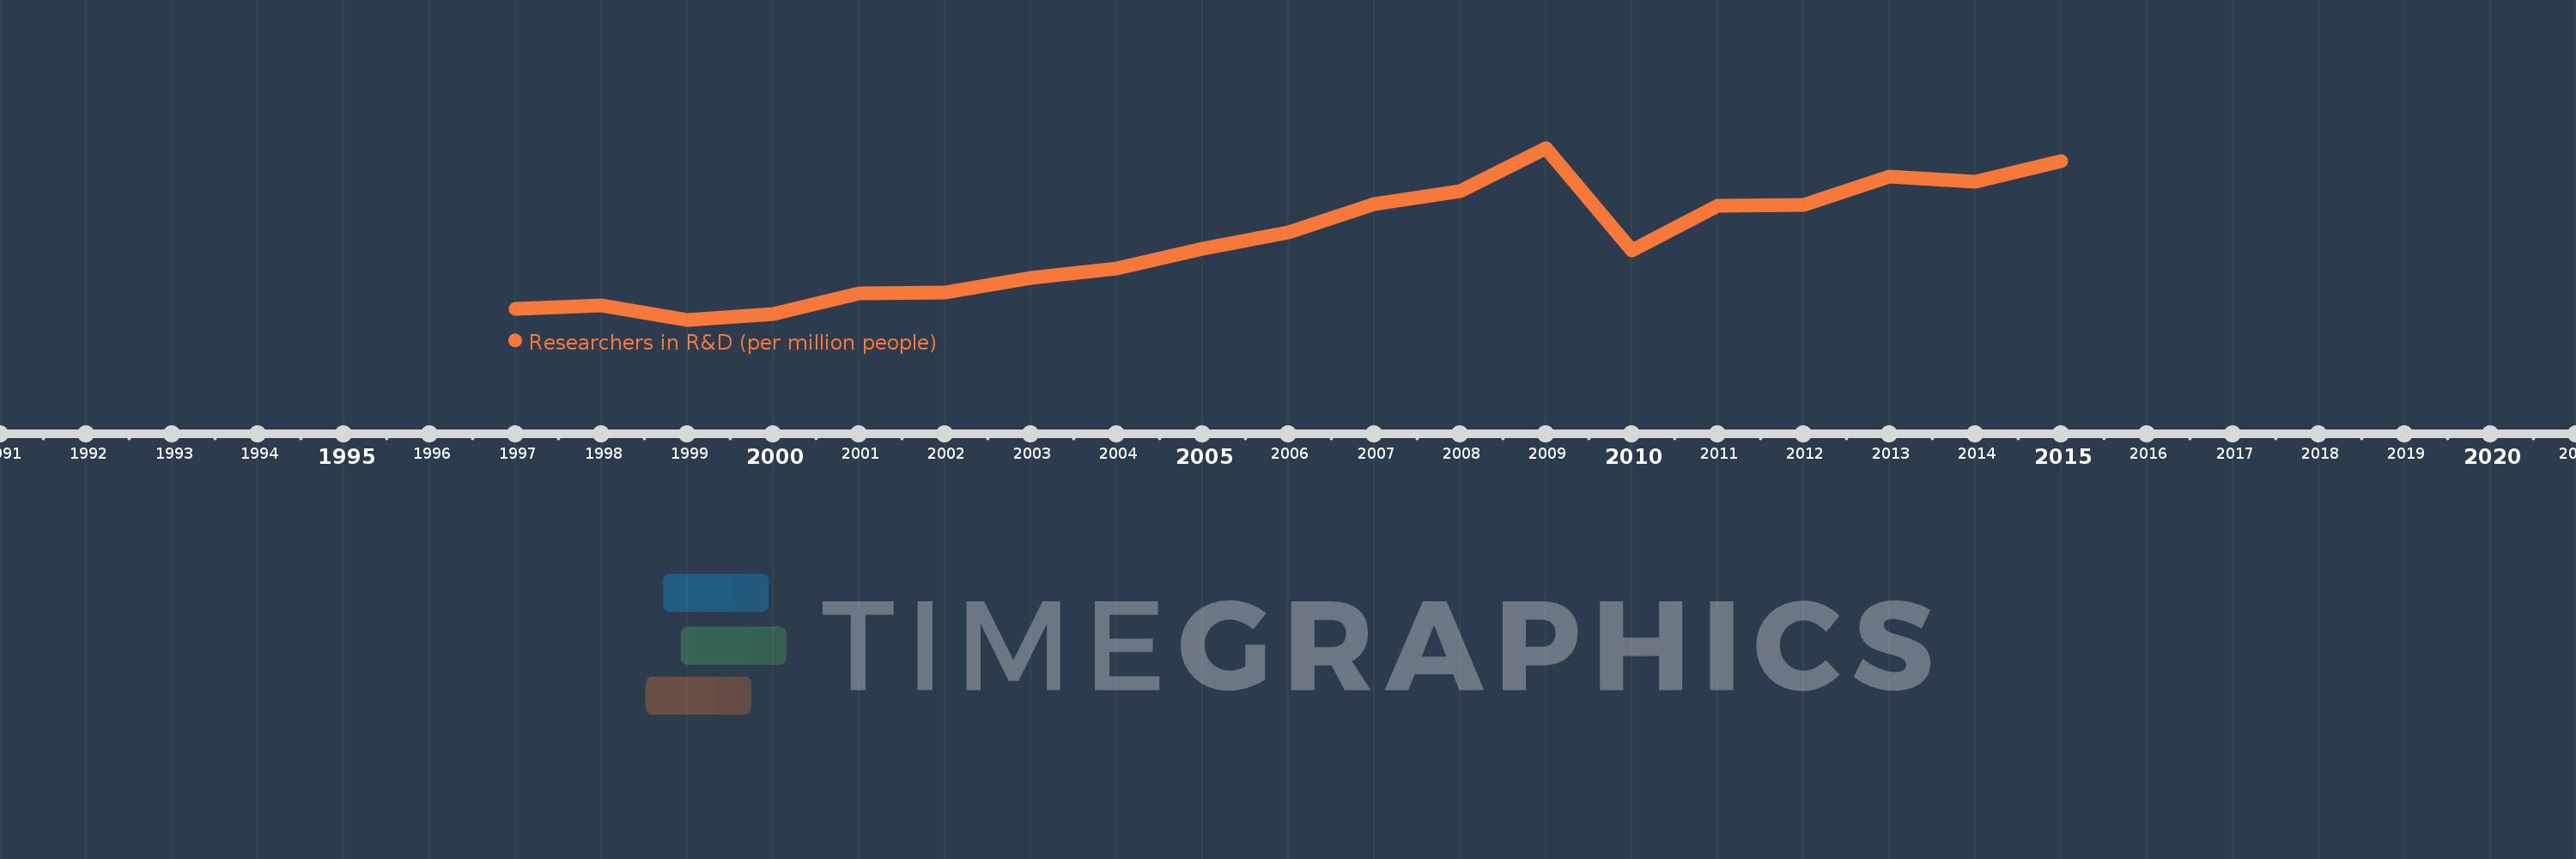
This timeline shows a graph from 1997 to 2015 of East Asia & Pacific (IDA & IBRD countries). No data until 1996. Number of actual observations by date: 19.
Source name:
World Development Indicators
Source organization:
United Nations Educational, Scientific, and Cultural Organization (UNESCO) Institute for Statistics.
Categories, topics:
Science & Technology
Last updated:
apr 23, 2017
Indicators value changes by year
Meaning:
743.775
Minimum:
369.314
jan 1, 1999
Maximum:
1.188K
jan 1, 2009
At the date of observation
Value
Absolute change
Change from the previous value
jan 1, 1997
421.022
+421.022
0.0%
jan 1, 1998
437.95
+16.928
4.02%
jan 1, 1999
369.314
-68.636
-15.67%
jan 1, 2000
394.937
+25.623
6.94%
jan 1, 2001
495.763
+100.826
25.53%
jan 1, 2002
501.047
+5.284
1.07%
jan 1, 2003
568.761
+67.714
13.51%
jan 1, 2004
615.533
+46.773
8.22%
jan 1, 2005
709.198
+93.665
15.22%
jan 1, 2006
786.198
+77.0
10.86%
jan 1, 2007
921.254
+135.055
17.18%
jan 1, 2008
984.149
+62.896
6.83%
jan 1, 2009
1.188K
+204.088
20.74%
jan 1, 2010
700.951
-487.286
-41.01%
jan 1, 2011
914.574
+213.623
30.48%
jan 1, 2012
916.345
+1.772
0.19%
jan 1, 2013
1.052K
+135.471
14.78%
jan 1, 2014
1.029K
-22.966
-2.18%
jan 1, 2015
1.126K
+96.978
9.43%
Ranking of countries by current statistics by years