33
/
AIzaSyAYiBZKx7MnpbEhh9jyipgxe19OcubqV5w
August 1, 2025
142638
Greenland
GRL
true
2
1
Researchers in R&D (per million people)
2005,2004,2003,2002
Download
Global statistics library →Greenland →

Researchers in R&D (per million people)

This statistics in other country:

AlbaniaAlgeriaAmerican SamoaAngolaArgentinaAustraliaAustriaBahrainBelgiumBoliviaBosnia and HerzegovinaBotswanaBrazilBrunei DarussalamBulgariaBurkina FasoCabo VerdeCambodiaCanadaCentral Europe and the BalticsChileChinaColombiaCongo, Rep.Costa RicaCote d'IvoireCroatiaCyprusCzech RepublicDenmarkEarly-demographic dividendEast Asia & PacificEast Asia & Pacific (excluding high income)East Asia & Pacific (IDA & IBRD countries)EcuadorEgypt, Arab Rep.EstoniaEthiopiaEuro areaEurope & Central AsiaEurope & Central Asia (excluding high income)Europe & Central Asia (IDA & IBRD countries)European UnionFaroe IslandsFinlandFranceGambia, TheGeorgiaGermanyGhanaGreeceGreenlandGuamGuatemalaHigh incomeHong Kong SAR, ChinaHungaryIBRD onlyIcelandIDA & IBRD totalIndiaIndonesiaIran, Islamic Rep.IraqIrelandIsraelItalyJapanJordanKazakhstanKenyaKorea, Rep.KuwaitLao PDRLate-demographic dividendLatin America & Caribbean Latin America & Caribbean (excluding high income)Latin America & the Caribbean (IDA & IBRD countries)LatviaLesothoLithuaniaLow & middle incomeLuxembourgMacao SAR, ChinaMacedonia, FYRMadagascarMalawiMalaysiaMaliMaltaMauritiusMexicoMiddle East & North Africa (excluding high income)Middle East & North Africa (IDA & IBRD countries)Middle incomeMoldovaMontenegroMoroccoMozambiqueMyanmarNepalNetherlandsNew ZealandNicaraguaNigerNigeriaNorth AmericaNorwayOECD membersOmanPakistanPanamaParaguayPhilippinesPolandPortugalPost-demographic dividendPuerto RicoQatarRomaniaRussian FederationRwandaSenegalSerbiaSeychellesSingaporeSlovak RepublicSloveniaSouth AfricaSouth AsiaSouth Asia (IDA & IBRD)SpainSri LankaSwedenSwitzerlandTanzaniaThailandTogoTunisiaTurkeyUgandaUkraineUnited KingdomUnited StatesUpper middle incomeUruguayUzbekistanVenezuela, RBVietnamWest Bank and GazaWorldZambiaZimbabwe

Timeline:

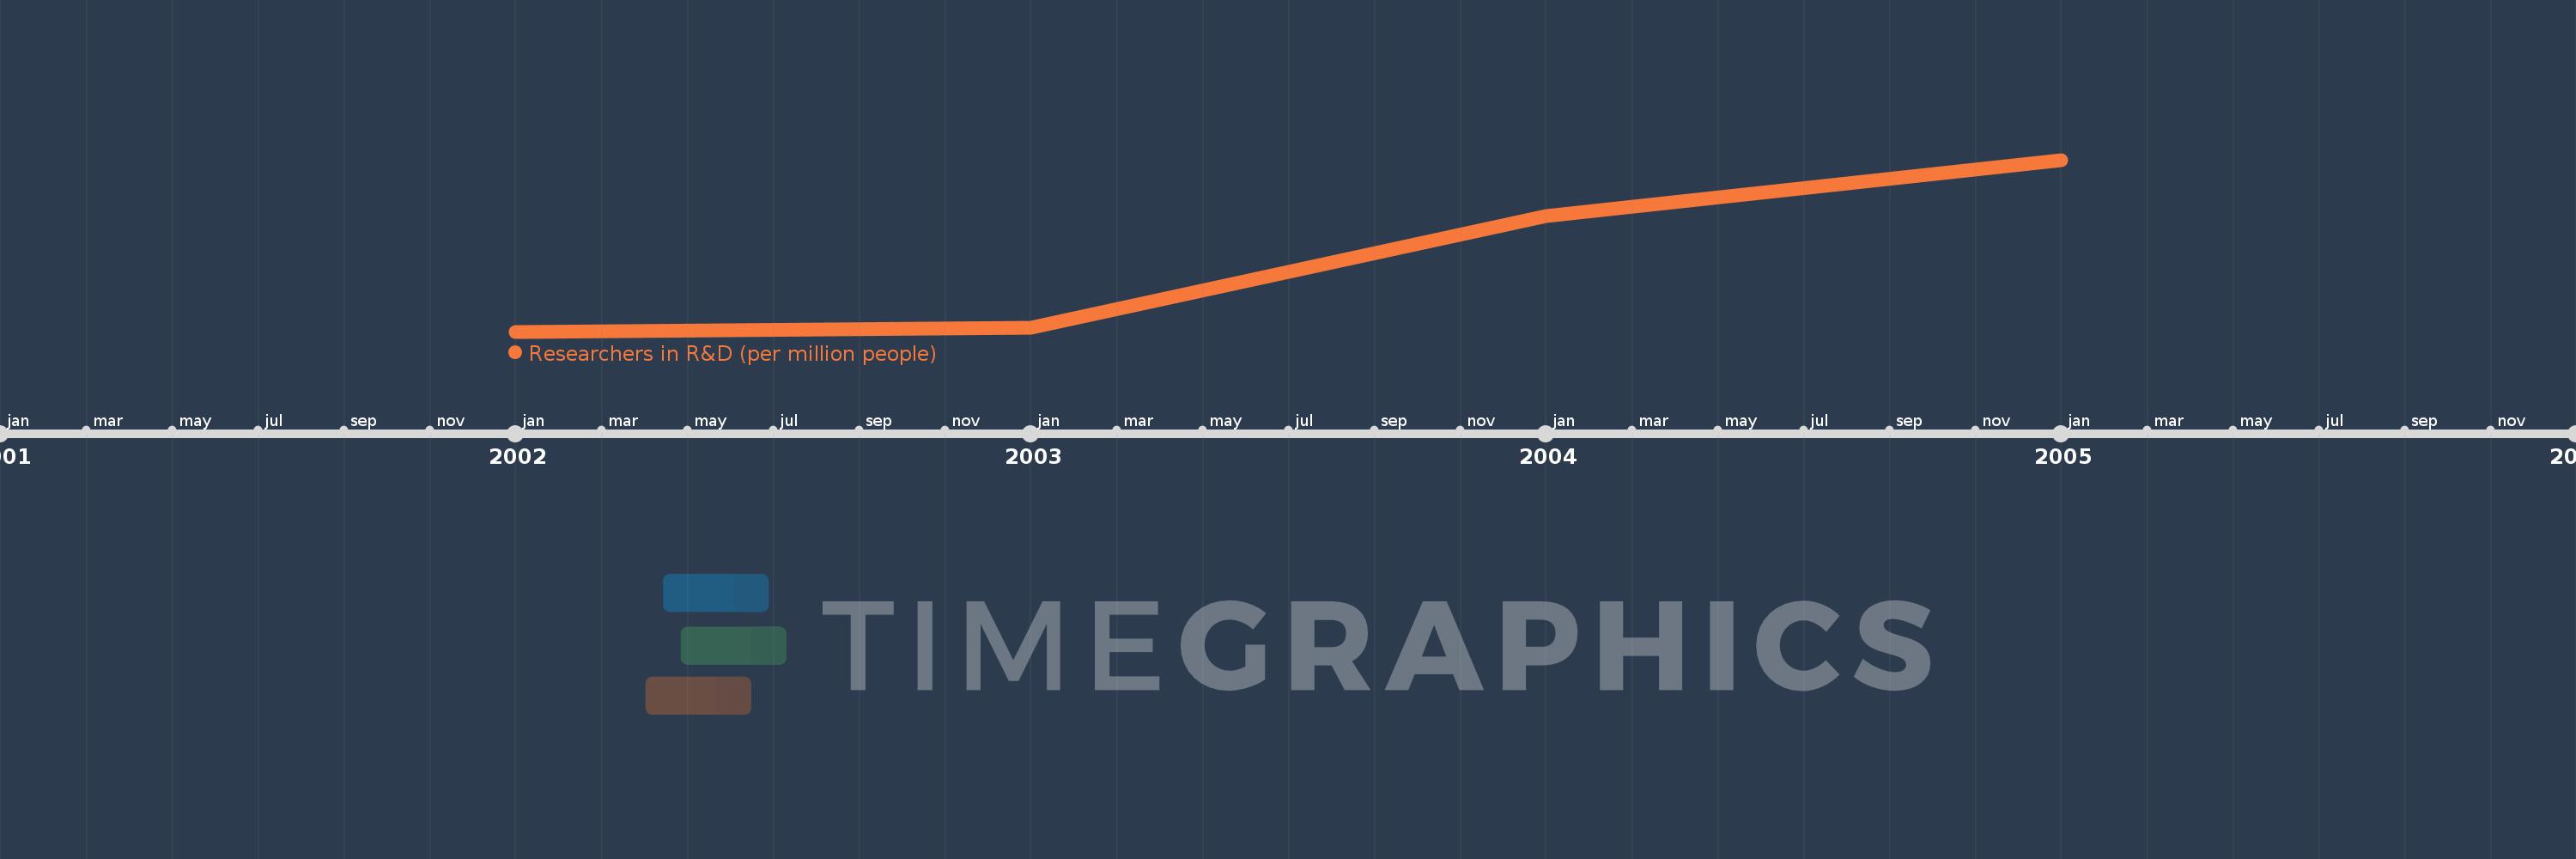
This timeline shows a graph from 2002 to 2005 of Greenland. No data until 2001. Number of actual observations by date: 4.

Source name:

World Development Indicators

Source organization:

United Nations Educational, Scientific, and Cultural Organization (UNESCO) Institute for Statistics.

Categories, topics:

Science & Technology

Last updated:

apr 23, 2017

Indicators value changes by year

Meaning:
605.981
Minimum:
536.06
jan 1, 2002
Maximum:
701.464
jan 1, 2005
At the date of observation
Value
Absolute change
Change from the previous value
jan 1, 2002
536.06
+536.06
0.0%
jan 1, 2003
539.498
+3.439
0.64%
jan 1, 2004
646.901
+107.403
19.91%
jan 1, 2005
701.464
+54.563
8.43%

Ranking of countries by current statistics by years