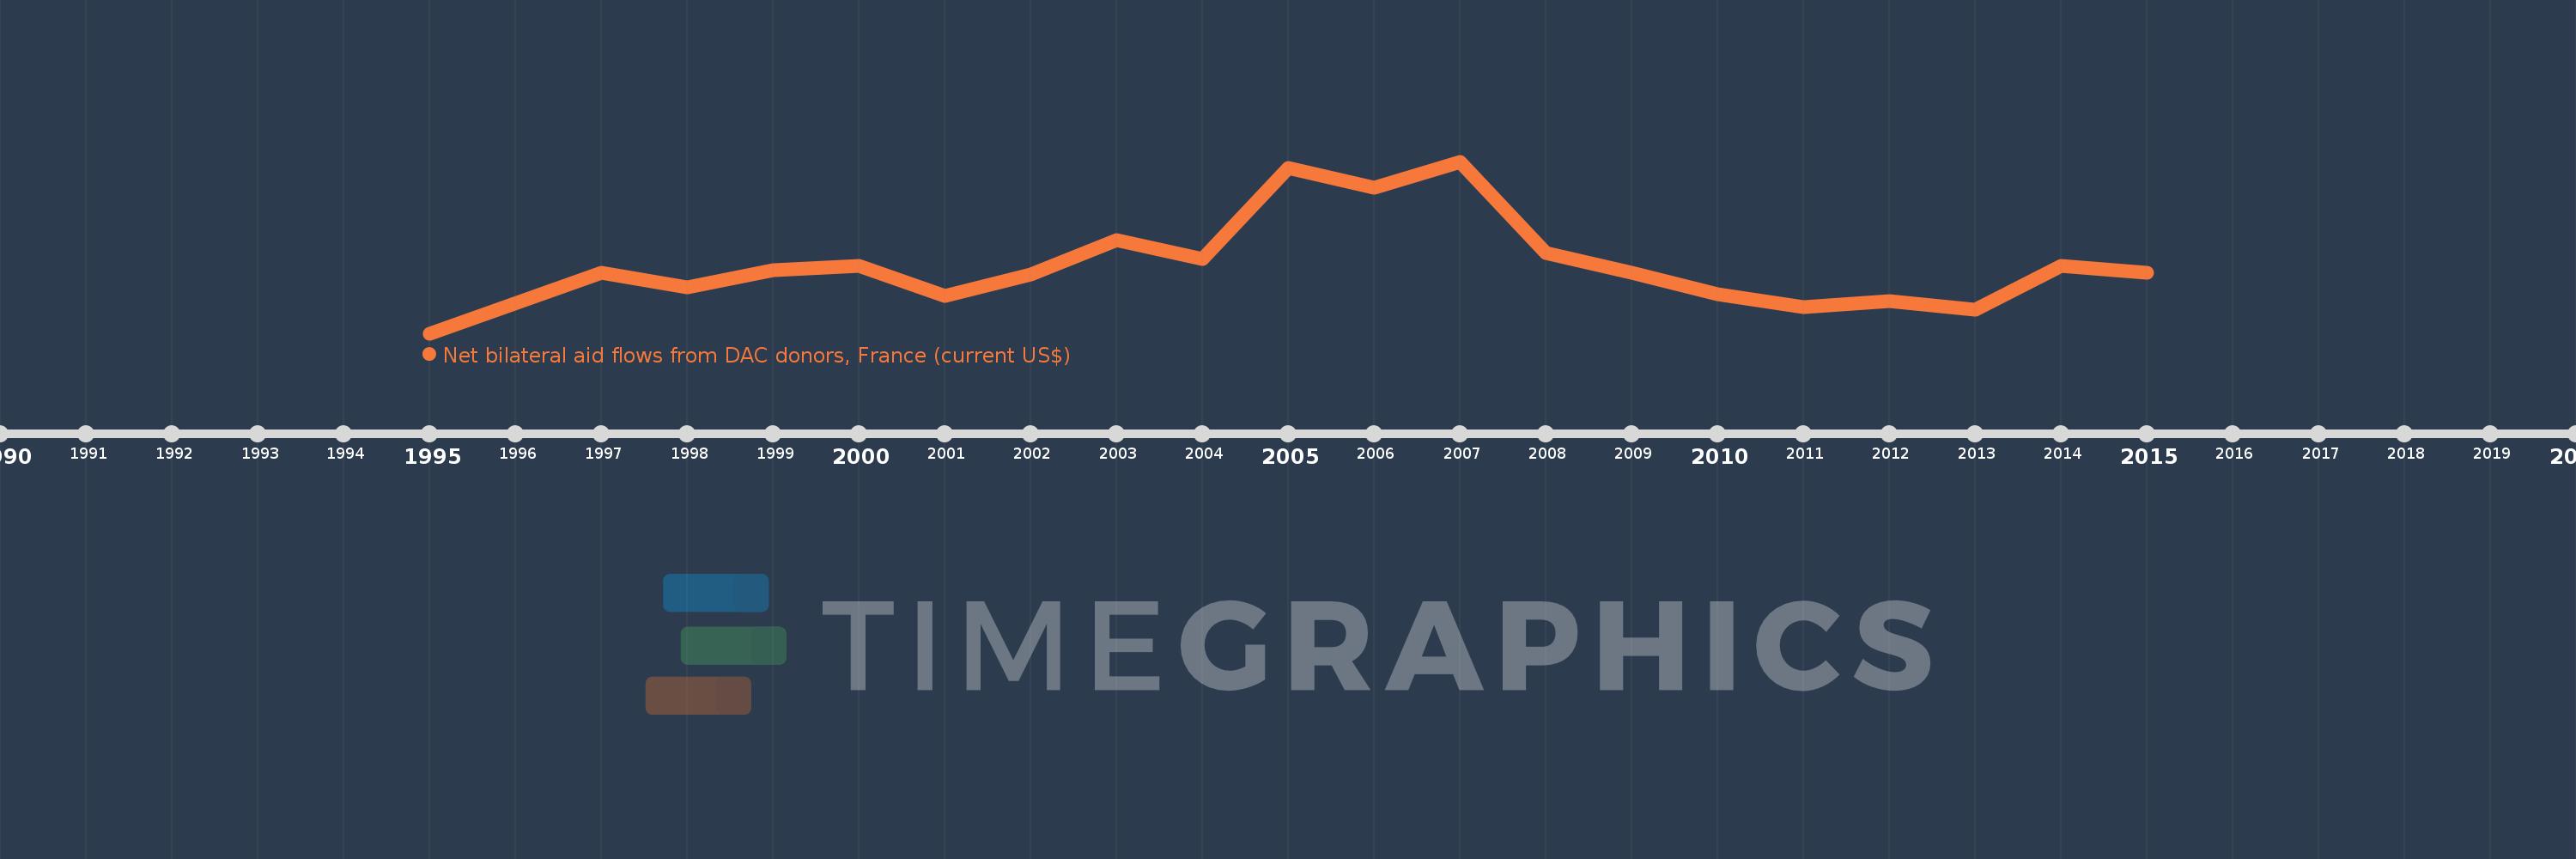
This timeline shows a graph from 1995 to 2015 of Turkmenistan. No data until 1994. Number of actual observations by date: 20.
Source name:
World Development Indicators
Source organization:
Development Assistance Committee of the Organisation for Economic Co-operation and Development, Geographical Distribution of Financial Flows to Developing Countries, Development Co-operation Report, and International Development Statistics database. Data are available online at: www.oecd.org/dac/stats/idsonline.
Categories, topics:
Aid Effectiveness
Last updated:
apr 23, 2017
Indicators value changes by year
Meaning:
326.0K
Minimum:
10.0K
jan 1, 1995
Maximum:
800.0K
jan 1, 2007
At the date of observation
Value
Absolute change
Change from the previous value
jan 1, 1995
10.0K
+10.0K
0.0%
jan 1, 1997
290.0K
+280.0K
2.8K%
jan 1, 1998
220.0K
-70.0K
-24.14%
jan 1, 1999
300.0K
+80.0K
36.36%
jan 1, 2000
320.0K
+20.0K
6.67%
jan 1, 2001
180.0K
-140.0K
-43.75%
jan 1, 2002
280.0K
+100.0K
55.56%
jan 1, 2003
440.0K
+160.0K
57.14%
jan 1, 2004
350.0K
-90.0K
-20.45%
jan 1, 2005
770.0K
+420.0K
120.0%
jan 1, 2006
680.0K
-90.0K
-11.69%
jan 1, 2007
800.0K
+120.0K
17.65%
jan 1, 2008
380.0K
-420.0K
-52.5%
jan 1, 2009
290.0K
-90.0K
-23.68%
jan 1, 2010
190.0K
-100.0K
-34.48%
jan 1, 2011
130.0K
-60.0K
-31.58%
jan 1, 2012
160.0K
+30.0K
23.08%
jan 1, 2013
120.0K
-40.0K
-25.0%
jan 1, 2014
320.0K
+200.0K
166.67%
jan 1, 2015
290.0K
-30.0K
-9.38%
Ranking of countries by current statistics by years