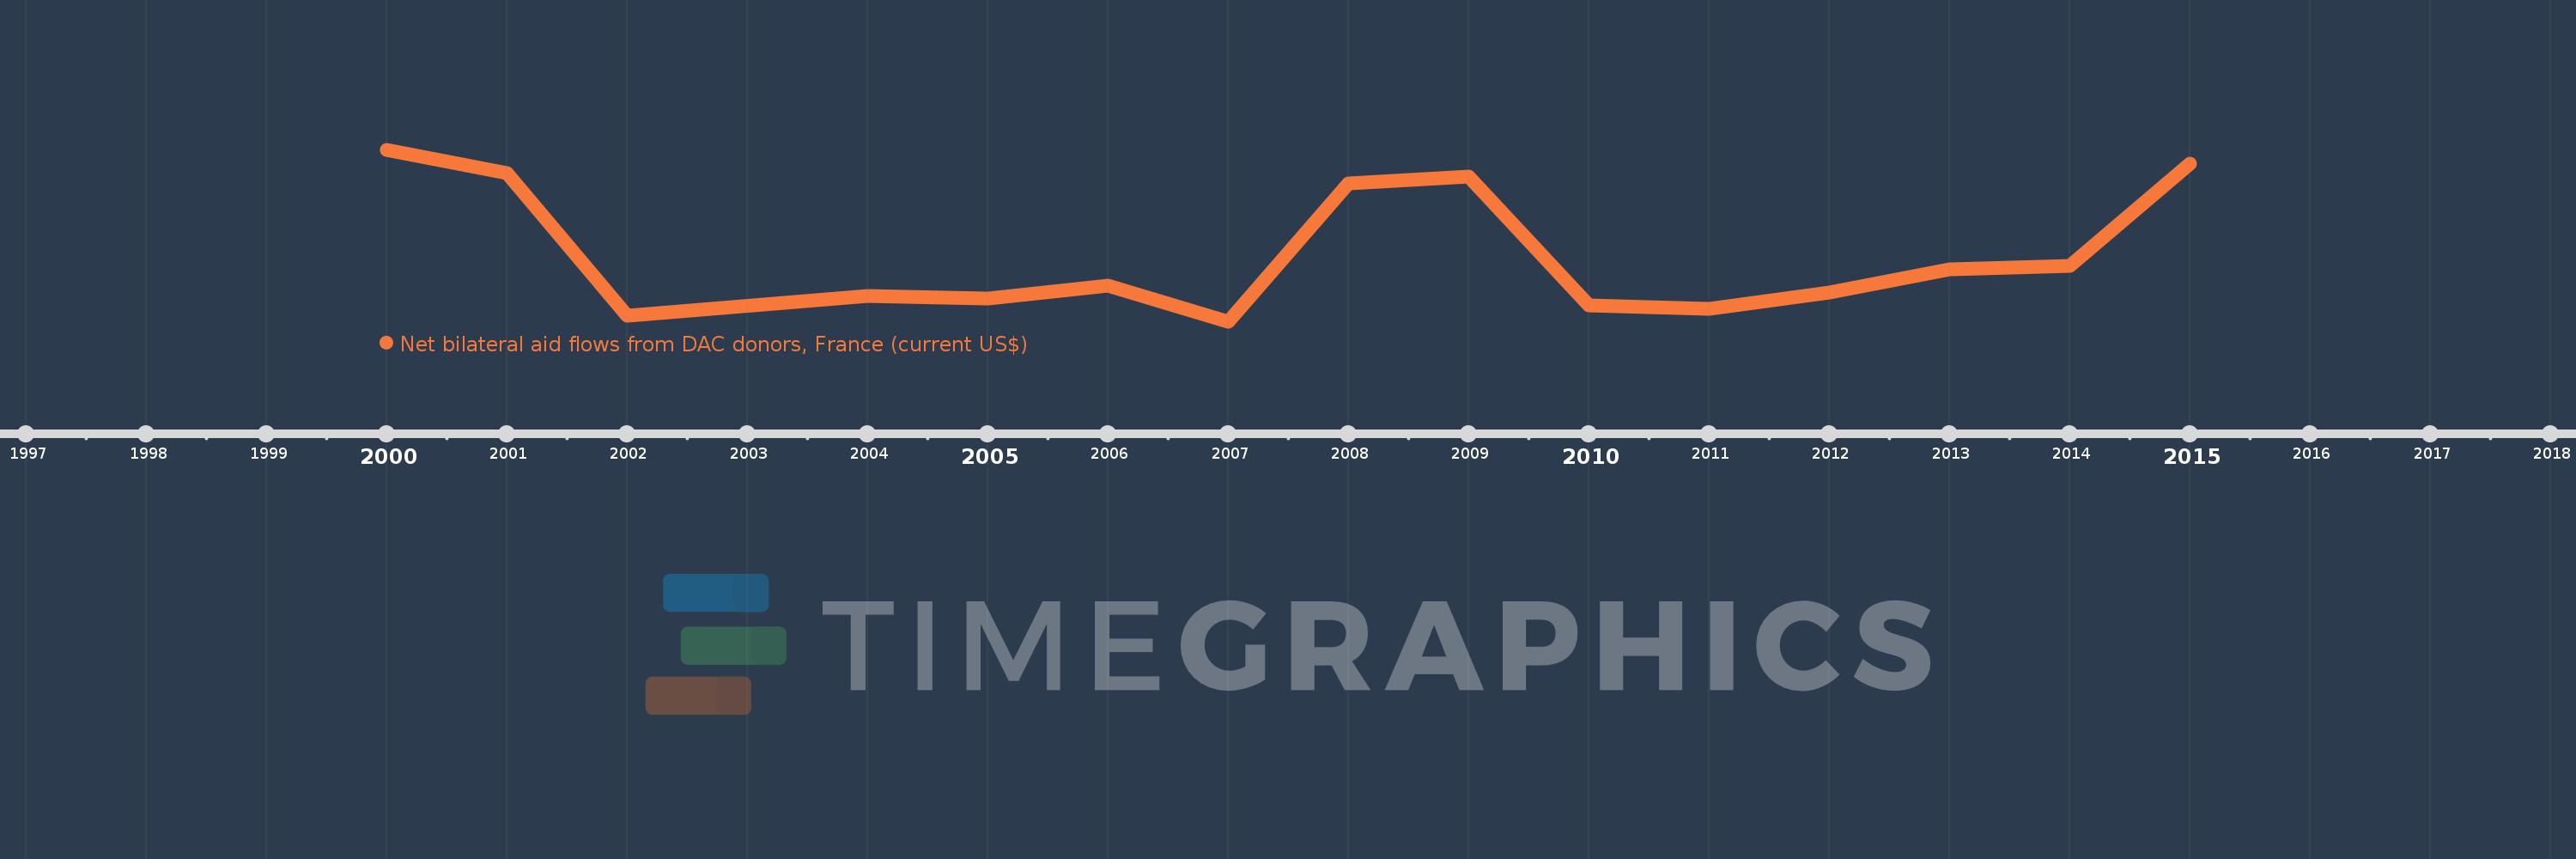
This timeline shows a graph from 2000 to 2015 of Timor-Leste. No data until 1999. Number of actual observations by date: 15.
Source name:
World Development Indicators
Source organization:
Development Assistance Committee of the Organisation for Economic Co-operation and Development, Geographical Distribution of Financial Flows to Developing Countries, Development Co-operation Report, and International Development Statistics database. Data are available online at: www.oecd.org/dac/stats/idsonline.
Categories, topics:
Aid Effectiveness
Last updated:
apr 23, 2017
Indicators value changes by year
Meaning:
286.667K
Minimum:
80.0K
jan 1, 2007
Maximum:
600.0K
jan 1, 2000
At the date of observation
Value
Absolute change
Change from the previous value
jan 1, 2000
600.0K
+600.0K
0.0%
jan 1, 2001
530.0K
-70.0K
-11.67%
jan 1, 2002
100.0K
-430.0K
-81.13%
jan 1, 2004
160.0K
+60.0K
60.0%
jan 1, 2005
150.0K
-10.0K
-6.25%
jan 1, 2006
190.0K
+40.0K
26.67%
jan 1, 2007
80.0K
-110.0K
-57.89%
jan 1, 2008
500.0K
+420.0K
525.0%
jan 1, 2009
520.0K
+20.0K
4.0%
jan 1, 2010
130.0K
-390.0K
-75.0%
jan 1, 2011
120.0K
-10.0K
-7.69%
jan 1, 2012
170.0K
+50.0K
41.67%
jan 1, 2013
240.0K
+70.0K
41.18%
jan 1, 2014
250.0K
+10.0K
4.17%
jan 1, 2015
560.0K
+310.0K
124.0%
Ranking of countries by current statistics by years