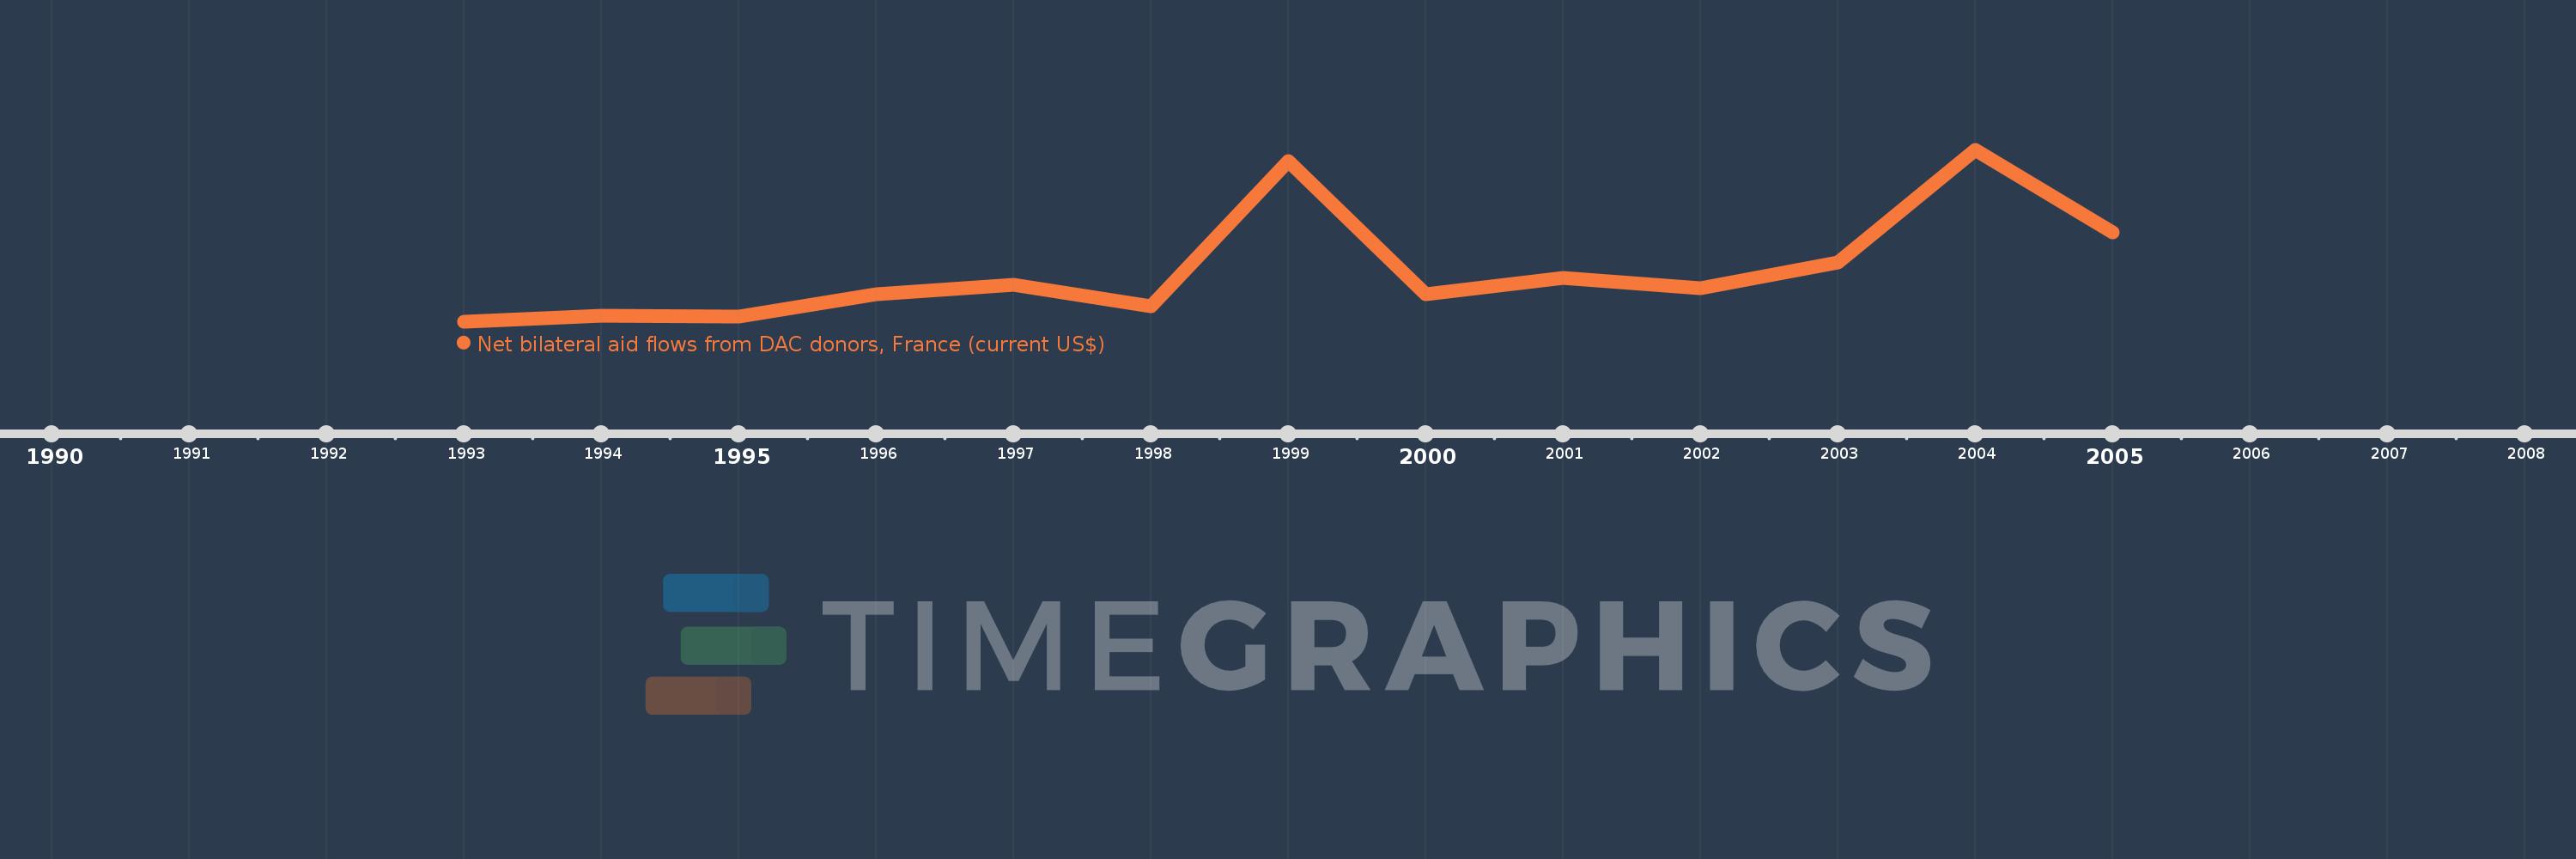
This timeline shows a graph from 1993 to 2005 of Latvia. No data until 1992. Number of actual observations by date: 13.
Source name:
World Development Indicators
Source organization:
Development Assistance Committee of the Organisation for Economic Co-operation and Development, Geographical Distribution of Financial Flows to Developing Countries, Development Co-operation Report, and International Development Statistics database. Data are available online at: www.oecd.org/dac/stats/idsonline.
Categories, topics:
Aid Effectiveness
Last updated:
apr 23, 2017
Indicators value changes by year
Meaning:
1.279 mln
Minimum:
290.0K
jan 1, 1993
Maximum:
3.54 mln
jan 1, 2004
At the date of observation
Value
Absolute change
Change from the previous value
jan 1, 1993
290.0K
+290.0K
0.0%
jan 1, 1994
410.0K
+120.0K
41.38%
jan 1, 1995
390.0K
-20.0K
-4.88%
jan 1, 1996
820.0K
+430.0K
110.26%
jan 1, 1997
1000.0K
+180.0K
21.95%
jan 1, 1998
590.0K
-410.0K
-41.0%
jan 1, 1999
3.34 mln
+2.75 mln
466.1%
jan 1, 2000
810.0K
-2.53 mln
-75.75%
jan 1, 2001
1.12 mln
+310.0K
38.27%
jan 1, 2002
930.0K
-190.0K
-16.96%
jan 1, 2003
1.41 mln
+480.0K
51.61%
jan 1, 2004
3.54 mln
+2.13 mln
151.06%
jan 1, 2005
1.98 mln
-1.56 mln
-44.07%
Ranking of countries by current statistics by years