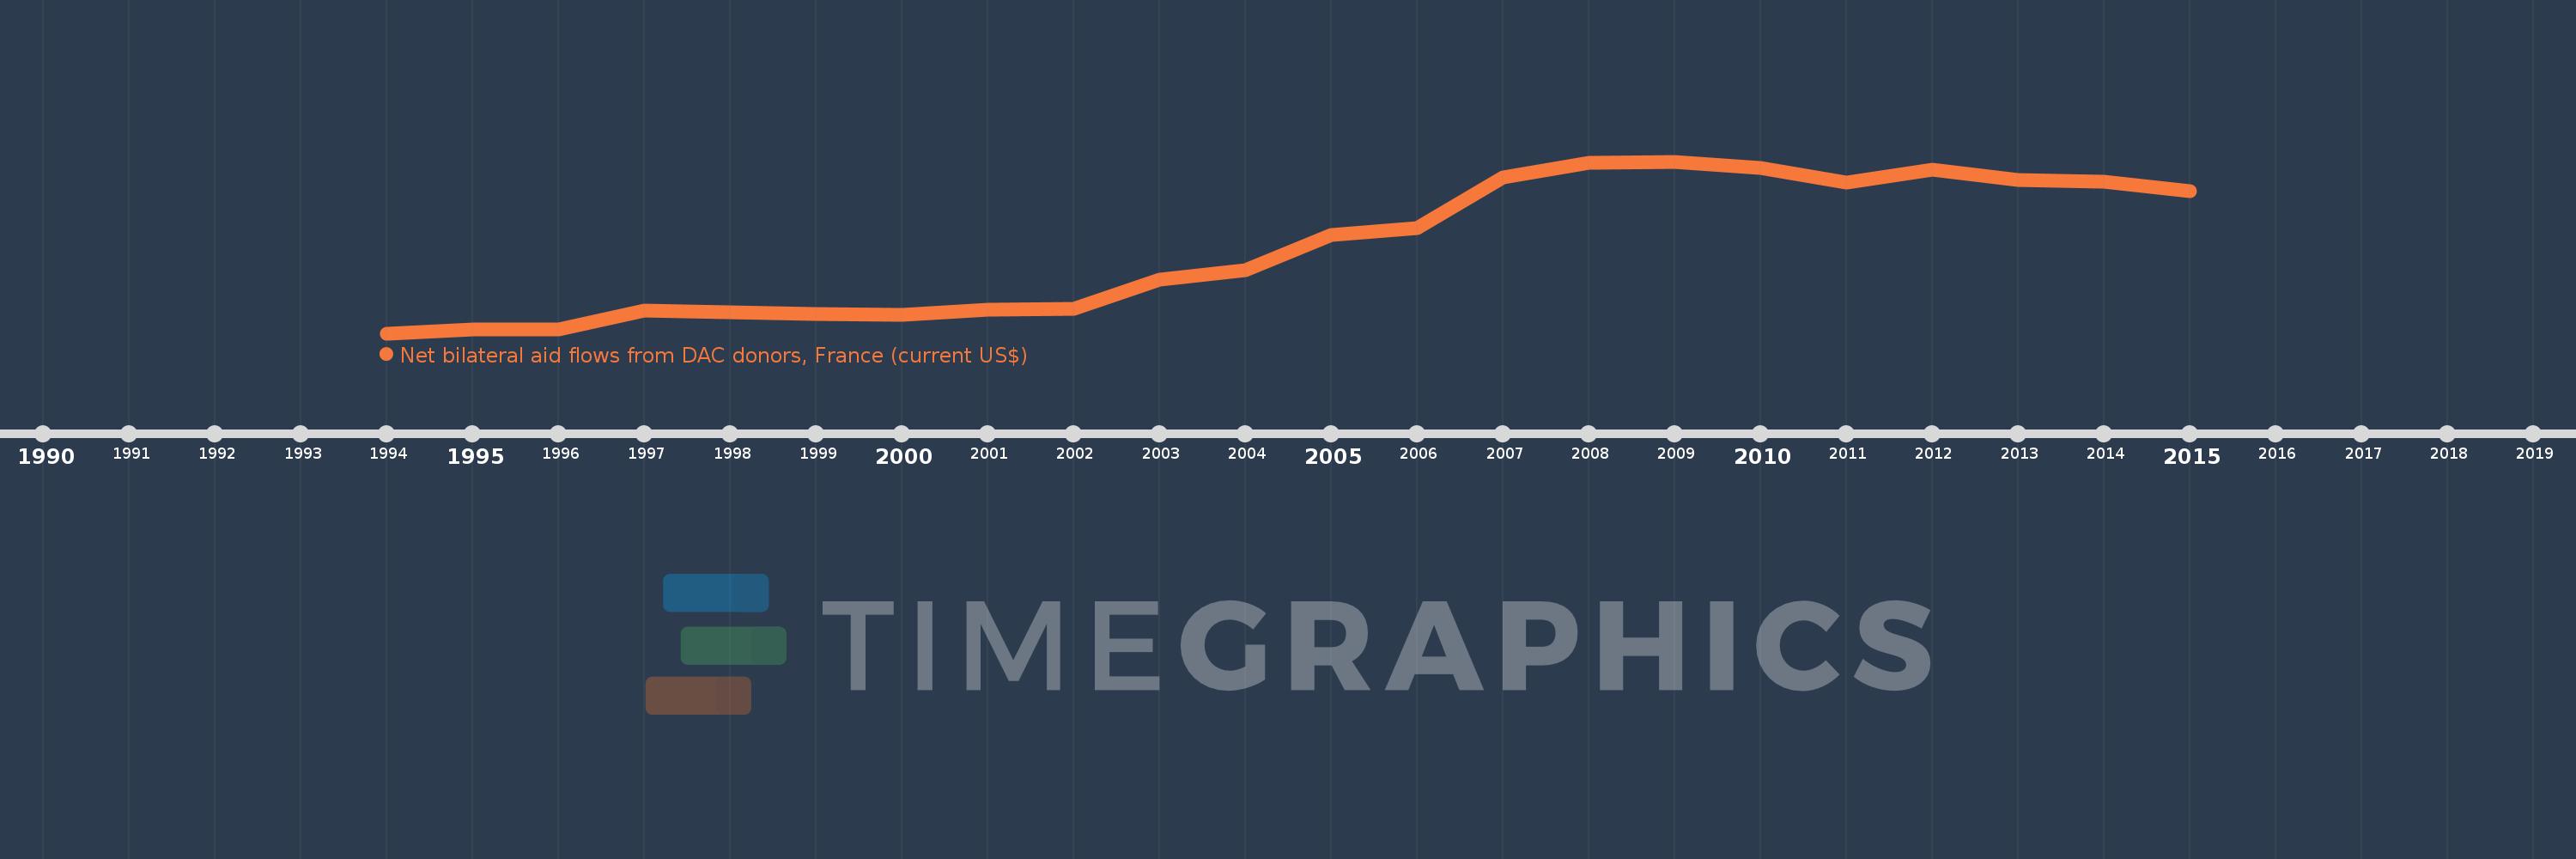
This timeline shows a graph from 1994 to 2015 of Moldova. No data until 1993. Number of actual observations by date: 21.
Source name:
World Development Indicators
Source organization:
Development Assistance Committee of the Organisation for Economic Co-operation and Development, Geographical Distribution of Financial Flows to Developing Countries, Development Co-operation Report, and International Development Statistics database. Data are available online at: www.oecd.org/dac/stats/idsonline.
Categories, topics:
Aid Effectiveness
Last updated:
apr 23, 2017
Indicators value changes by year
Meaning:
3.789 mln
Minimum:
30.0K
jan 1, 1994
Maximum:
7.32 mln
jan 1, 2009
At the date of observation
Value
Absolute change
Change from the previous value
jan 1, 1994
30.0K
+30.0K
0.0%
jan 1, 1995
180.0K
+150.0K
500.0%
jan 1, 1996
190.0K
+10.0K
5.56%
jan 1, 1997
1000.0K
+810.0K
426.32%
jan 1, 1999
850.0K
-150.0K
-15.0%
jan 1, 2000
820.0K
-30.0K
-3.53%
jan 1, 2001
1.03 mln
+210.0K
25.61%
jan 1, 2002
1.08 mln
+50.0K
4.85%
jan 1, 2003
2.29 mln
+1.21 mln
112.04%
jan 1, 2004
2.71 mln
+420.0K
18.34%
jan 1, 2005
4.19 mln
+1.48 mln
54.61%
jan 1, 2006
4.48 mln
+290.0K
6.92%
jan 1, 2007
6.63 mln
+2.15 mln
47.99%
jan 1, 2008
7.26 mln
+630.0K
9.5%
jan 1, 2009
7.32 mln
+60.0K
0.83%
jan 1, 2010
7.03 mln
-290.0K
-3.96%
jan 1, 2011
6.44 mln
-590.0K
-8.39%
jan 1, 2012
6.97 mln
+530.0K
8.23%
jan 1, 2013
6.54 mln
-430.0K
-6.17%
jan 1, 2014
6.46 mln
-80.0K
-1.22%
jan 1, 2015
6.06 mln
-400.0K
-6.19%
Ranking of countries by current statistics by years