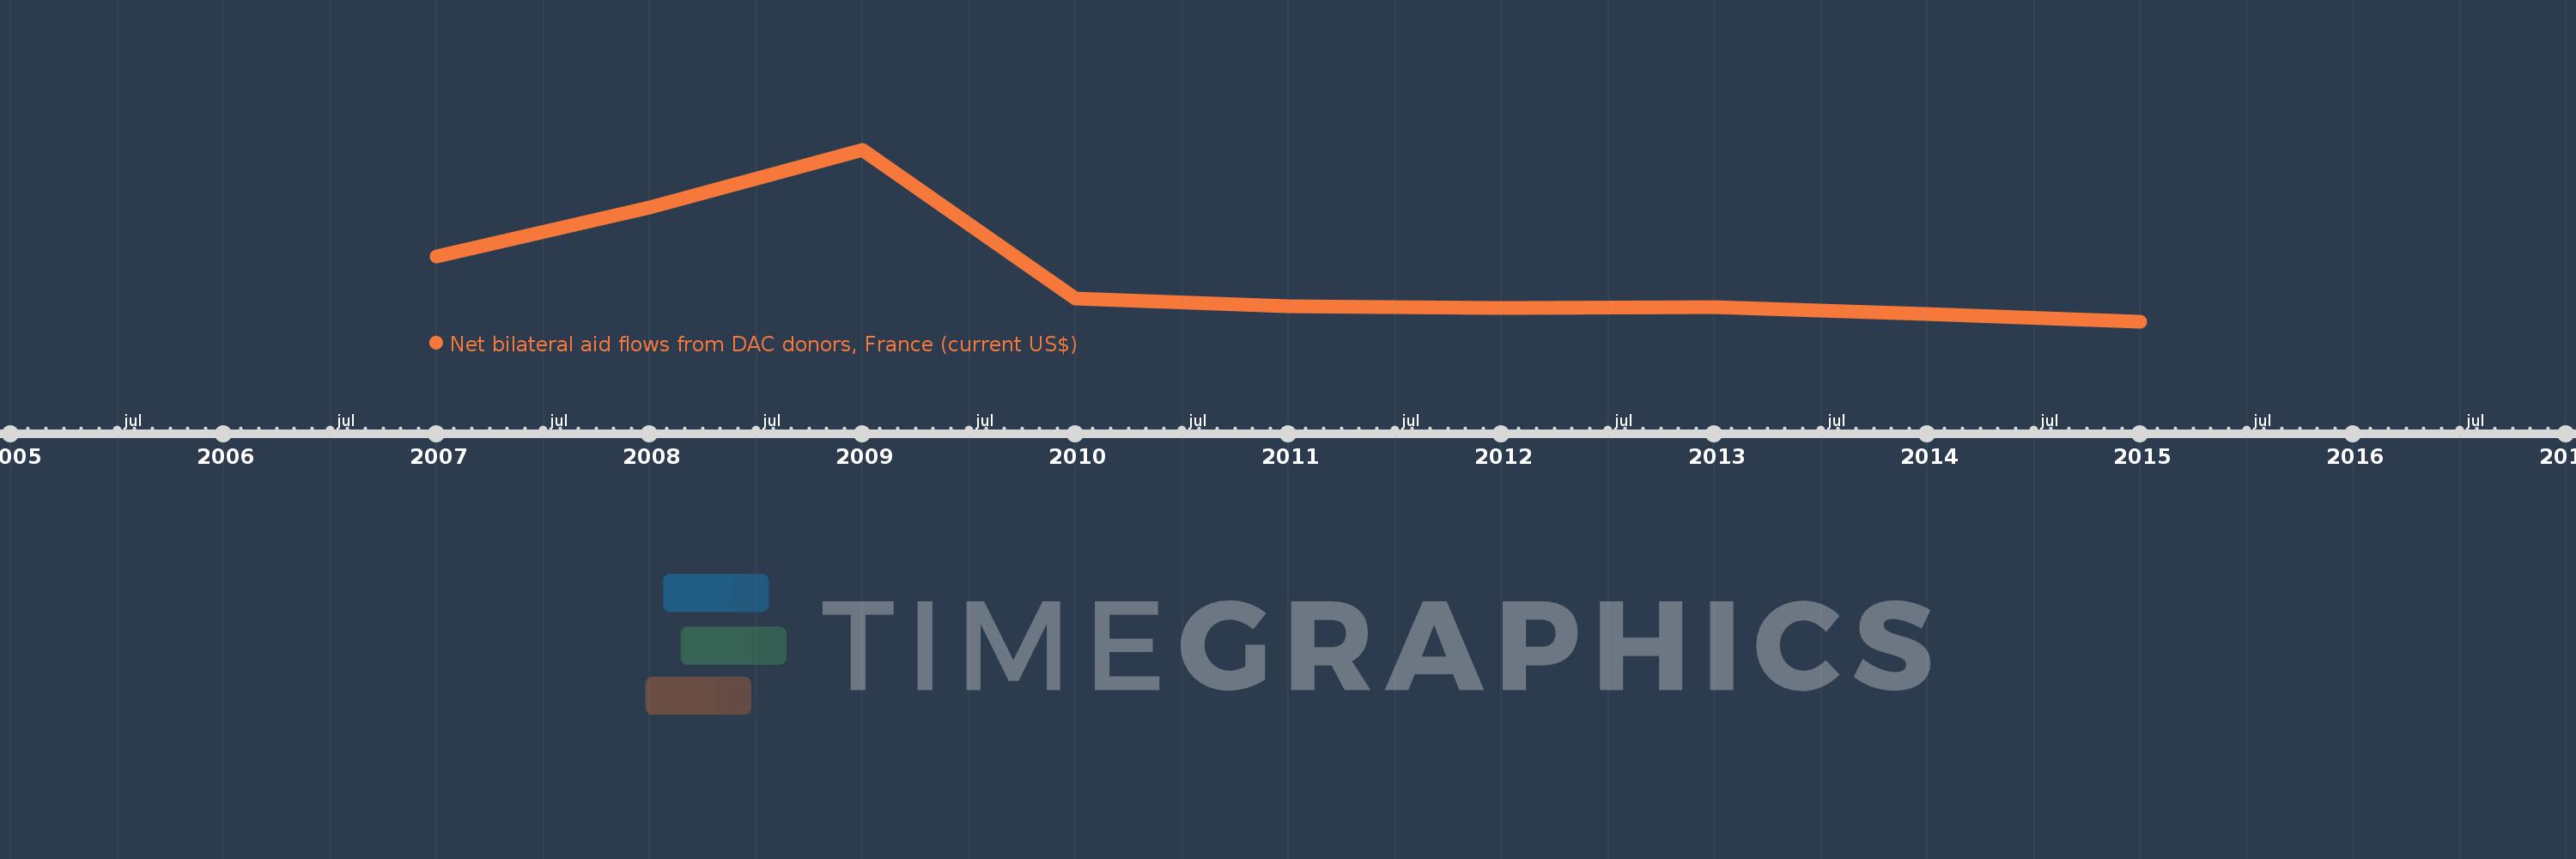
This timeline shows a graph from 2007 to 2015 of Montenegro. No data until 2006. Number of actual observations by date: 9.
Source name:
World Development Indicators
Source organization:
Development Assistance Committee of the Organisation for Economic Co-operation and Development, Geographical Distribution of Financial Flows to Developing Countries, Development Co-operation Report, and International Development Statistics database. Data are available online at: www.oecd.org/dac/stats/idsonline.
Categories, topics:
Aid Effectiveness
Last updated:
apr 23, 2017
Indicators value changes by year
Meaning:
2.538 mln
Minimum:
-300.0K
jan 1, 2015
Maximum:
9.94 mln
jan 1, 2009
At the date of observation
Value
Absolute change
Change from the previous value
jan 1, 2007
3.63 mln
+3.63 mln
0.0%
jan 1, 2008
6.52 mln
+2.89 mln
79.61%
jan 1, 2009
9.94 mln
+3.42 mln
52.45%
jan 1, 2010
1.12 mln
-8.82 mln
-88.73%
jan 1, 2011
630.0K
-490.0K
-43.75%
jan 1, 2012
540.0K
-90.0K
-14.29%
jan 1, 2013
590.0K
+50.0K
9.26%
jan 1, 2014
170.0K
-420.0K
-71.19%
jan 1, 2015
-300.0K
-470.0K
-276.47%
Ranking of countries by current statistics by years