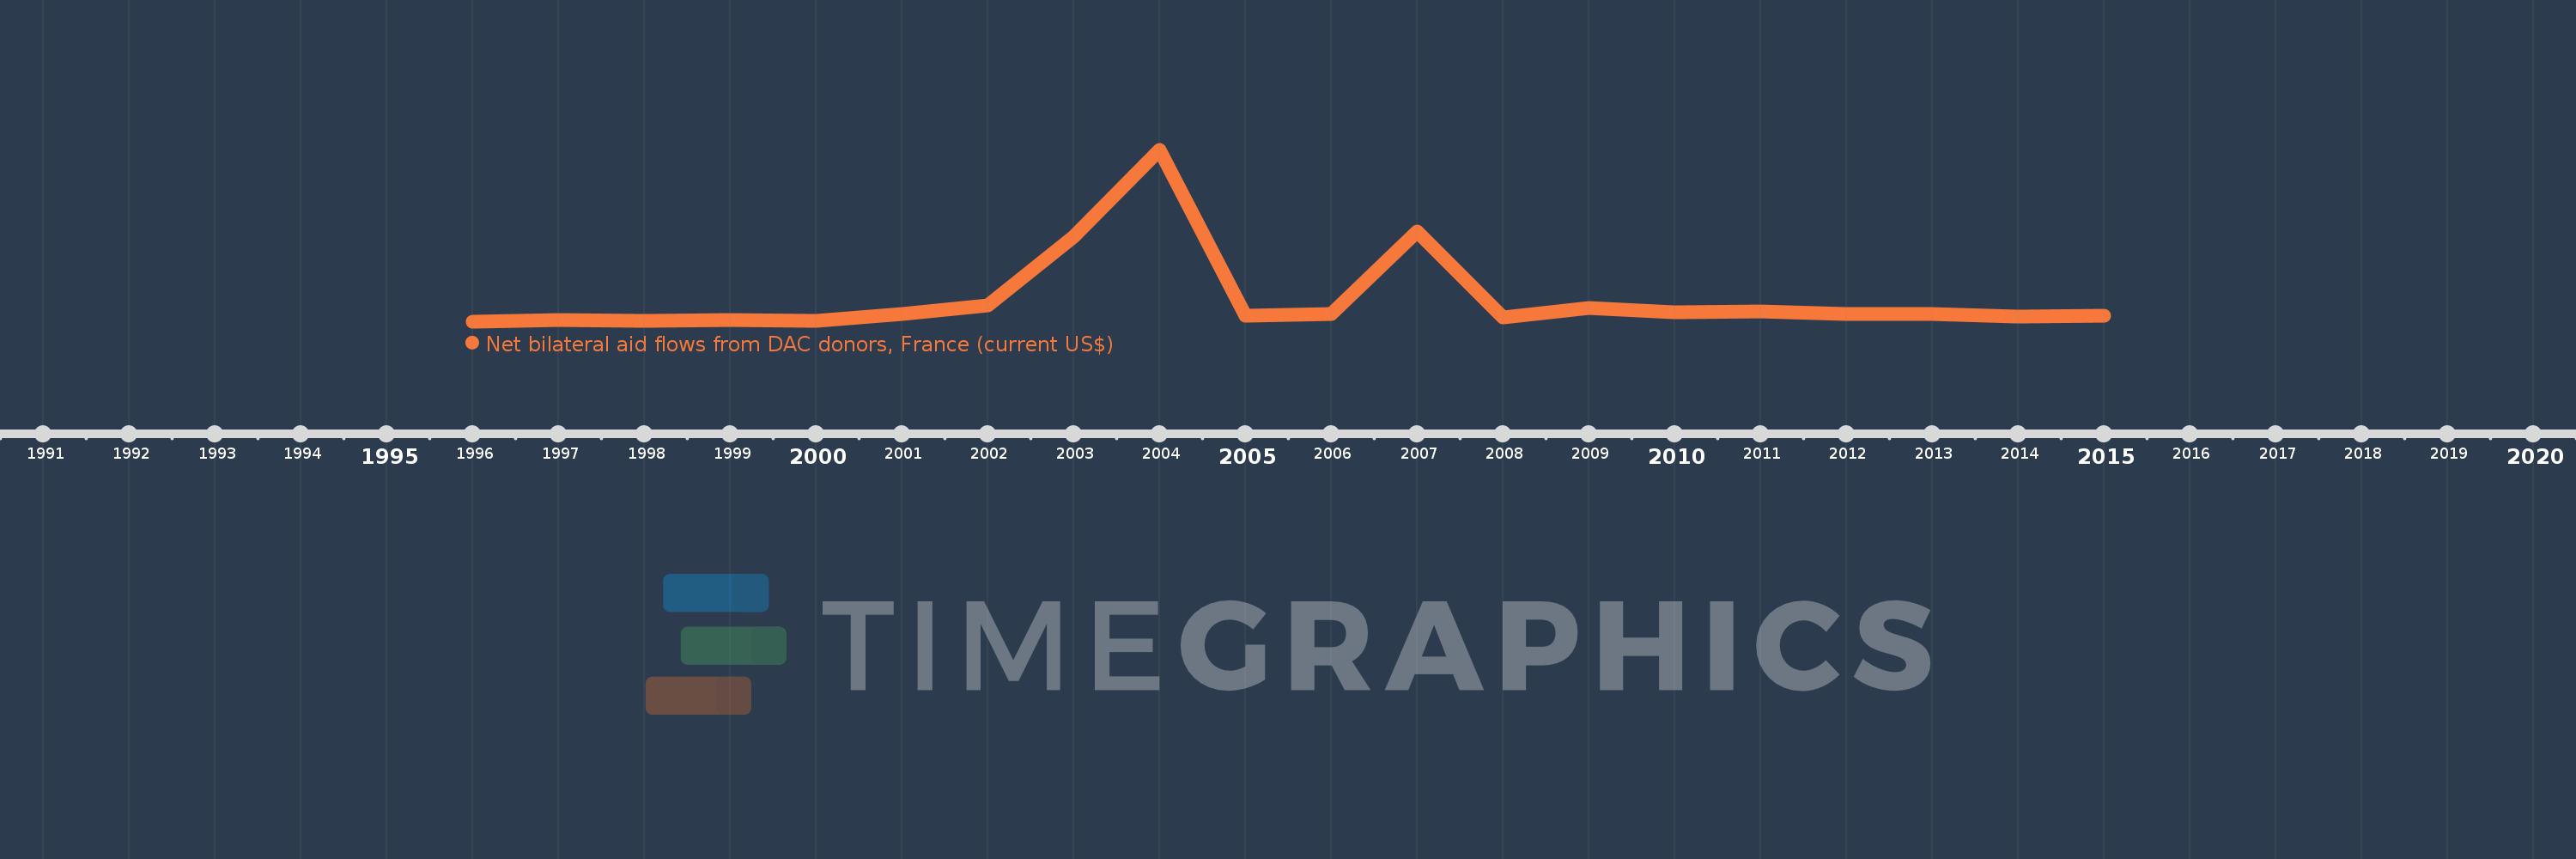
This timeline shows a graph from 1996 to 2015 of Serbia. No data until 1995. Number of actual observations by date: 20.
Source name:
World Development Indicators
Source organization:
Development Assistance Committee of the Organisation for Economic Co-operation and Development, Geographical Distribution of Financial Flows to Developing Countries, Development Co-operation Report, and International Development Statistics database. Data are available online at: www.oecd.org/dac/stats/idsonline.
Categories, topics:
Aid Effectiveness
Last updated:
apr 23, 2017
Indicators value changes by year
Meaning:
28.925 mln
Minimum:
1.33 mln
jan 1, 1996
Maximum:
207.89 mln
jan 1, 2004
At the date of observation
Value
Absolute change
Change from the previous value
jan 1, 1996
1.33 mln
+1.33 mln
0.0%
jan 1, 1997
3.19 mln
+1.86 mln
139.85%
jan 1, 1998
3.08 mln
-110.0K
-3.45%
jan 1, 1999
3.24 mln
+160.0K
5.19%
jan 1, 2000
3.01 mln
-230.0K
-7.1%
jan 1, 2001
10.94 mln
+7.93 mln
263.46%
jan 1, 2002
21.37 mln
+10.43 mln
95.34%
jan 1, 2003
103.74 mln
+82.37 mln
385.45%
jan 1, 2004
207.89 mln
+104.15 mln
100.4%
jan 1, 2005
8.95 mln
-198.94 mln
-95.69%
jan 1, 2006
11.34 mln
+2.39 mln
26.7%
jan 1, 2007
109.76 mln
+98.42 mln
867.9%
jan 1, 2008
7.3 mln
-102.46 mln
-93.35%
jan 1, 2009
17.82 mln
+10.52 mln
144.11%
jan 1, 2010
12.66 mln
-5.16 mln
-28.96%
jan 1, 2011
13.95 mln
+1.29 mln
10.19%
jan 1, 2012
11.27 mln
-2.68 mln
-19.21%
jan 1, 2013
10.8 mln
-470.0K
-4.17%
jan 1, 2014
8.19 mln
-2.61 mln
-24.17%
jan 1, 2015
8.67 mln
+480.0K
5.86%
Ranking of countries by current statistics by years