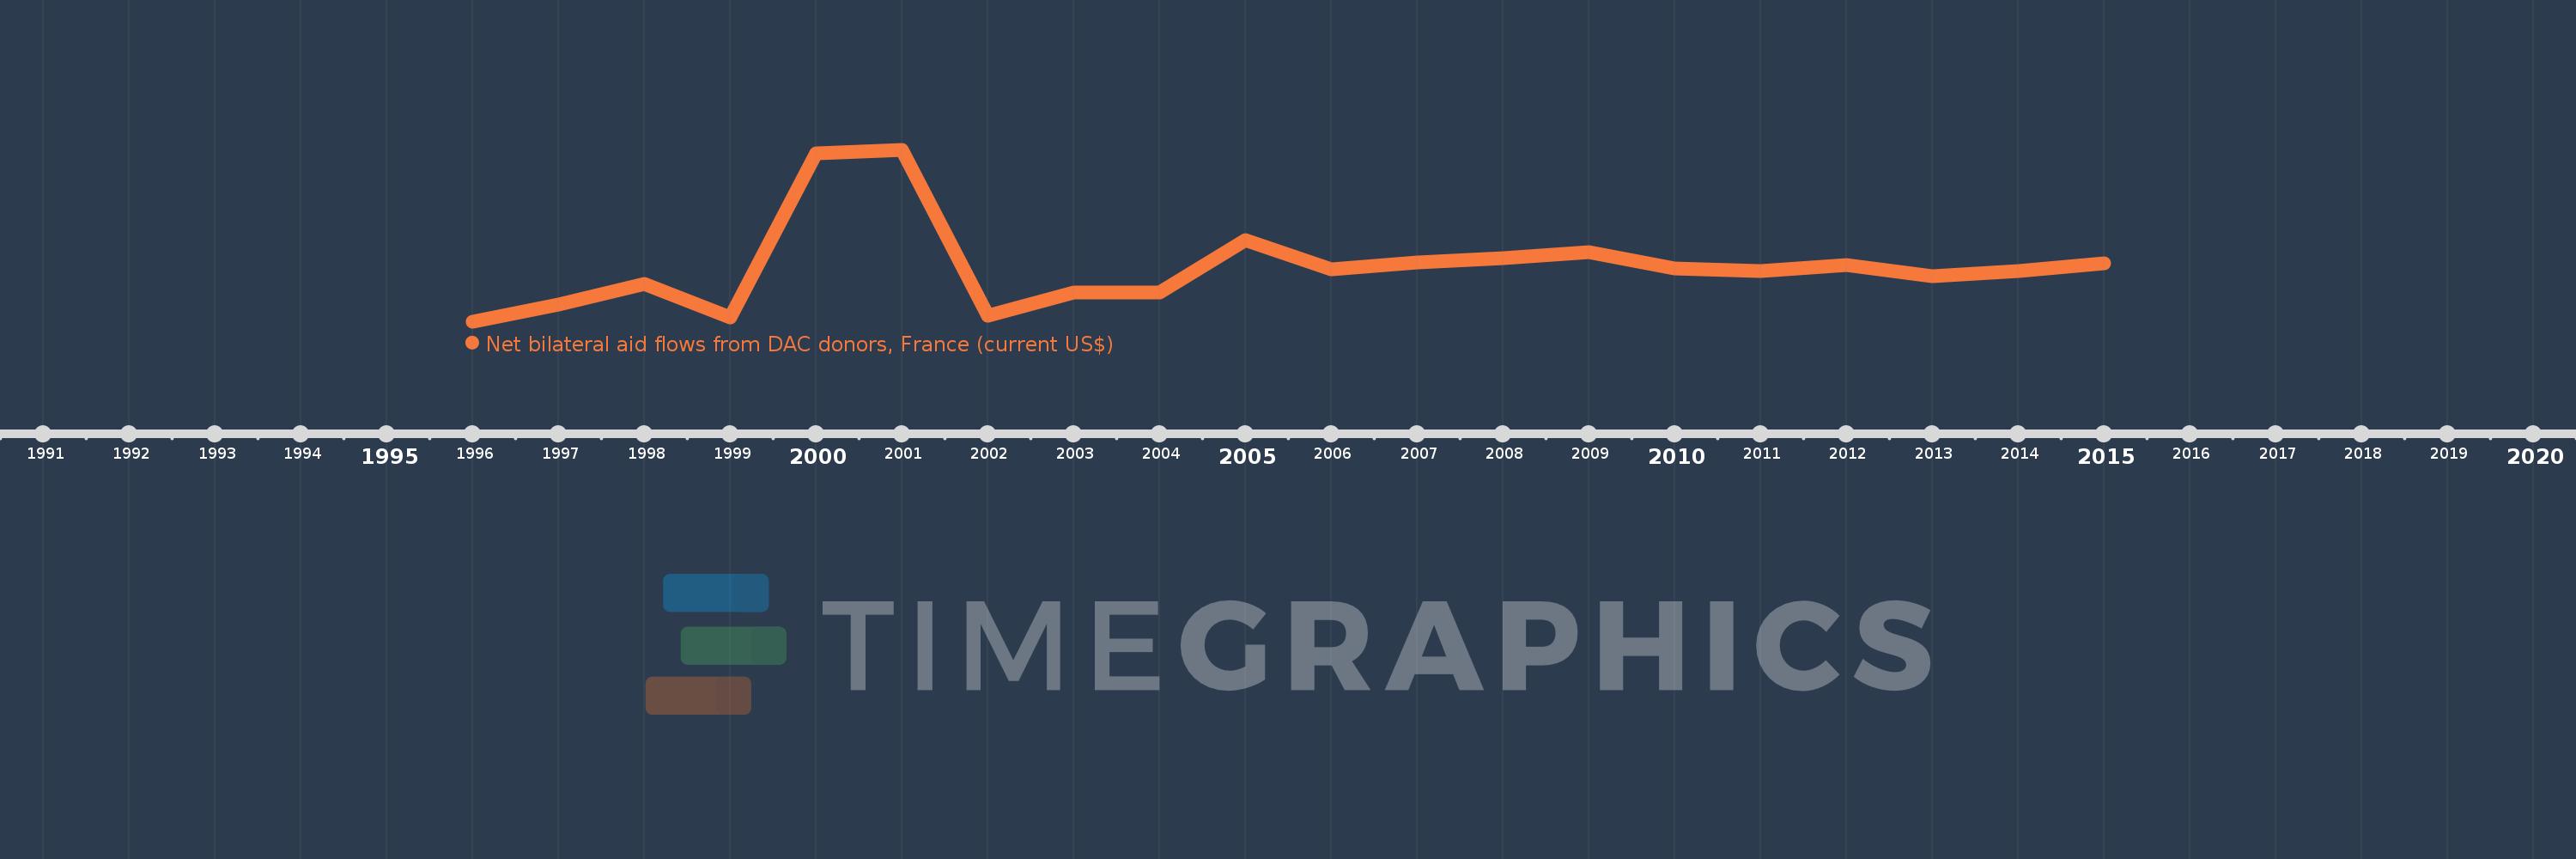
This timeline shows a graph from 1996 to 2015 of Macedonia, FYR. No data until 1995. Number of actual observations by date: 20.
Source name:
World Development Indicators
Source organization:
Development Assistance Committee of the Organisation for Economic Co-operation and Development, Geographical Distribution of Financial Flows to Developing Countries, Development Co-operation Report, and International Development Statistics database. Data are available online at: www.oecd.org/dac/stats/idsonline.
Categories, topics:
Aid Effectiveness
Last updated:
apr 23, 2017
Indicators value changes by year
Meaning:
3.123 mln
Minimum:
690.0K
jan 1, 1996
Maximum:
8.23 mln
jan 1, 2001
At the date of observation
Value
Absolute change
Change from the previous value
jan 1, 1996
690.0K
+690.0K
0.0%
jan 1, 1997
1.44 mln
+750.0K
108.7%
jan 1, 1998
2.37 mln
+930.0K
64.58%
jan 1, 1999
880.0K
-1.49 mln
-62.87%
jan 1, 2000
8.09 mln
+7.21 mln
819.32%
jan 1, 2001
8.23 mln
+140.0K
1.73%
jan 1, 2002
970.0K
-7.26 mln
-88.21%
jan 1, 2003
1.98 mln
+1.01 mln
104.12%
jan 1, 2004
2.0 mln
+20.0K
1.01%
jan 1, 2005
4.28 mln
+2.28 mln
114.0%
jan 1, 2006
3.0 mln
-1.28 mln
-29.91%
jan 1, 2007
3.31 mln
+310.0K
10.33%
jan 1, 2008
3.48 mln
+170.0K
5.14%
jan 1, 2009
3.75 mln
+270.0K
7.76%
jan 1, 2010
3.02 mln
-730.0K
-19.47%
jan 1, 2011
2.91 mln
-110.0K
-3.64%
jan 1, 2012
3.18 mln
+270.0K
9.28%
jan 1, 2013
2.71 mln
-470.0K
-14.78%
jan 1, 2014
2.92 mln
+210.0K
7.75%
jan 1, 2015
3.25 mln
+330.0K
11.3%
Ranking of countries by current statistics by years