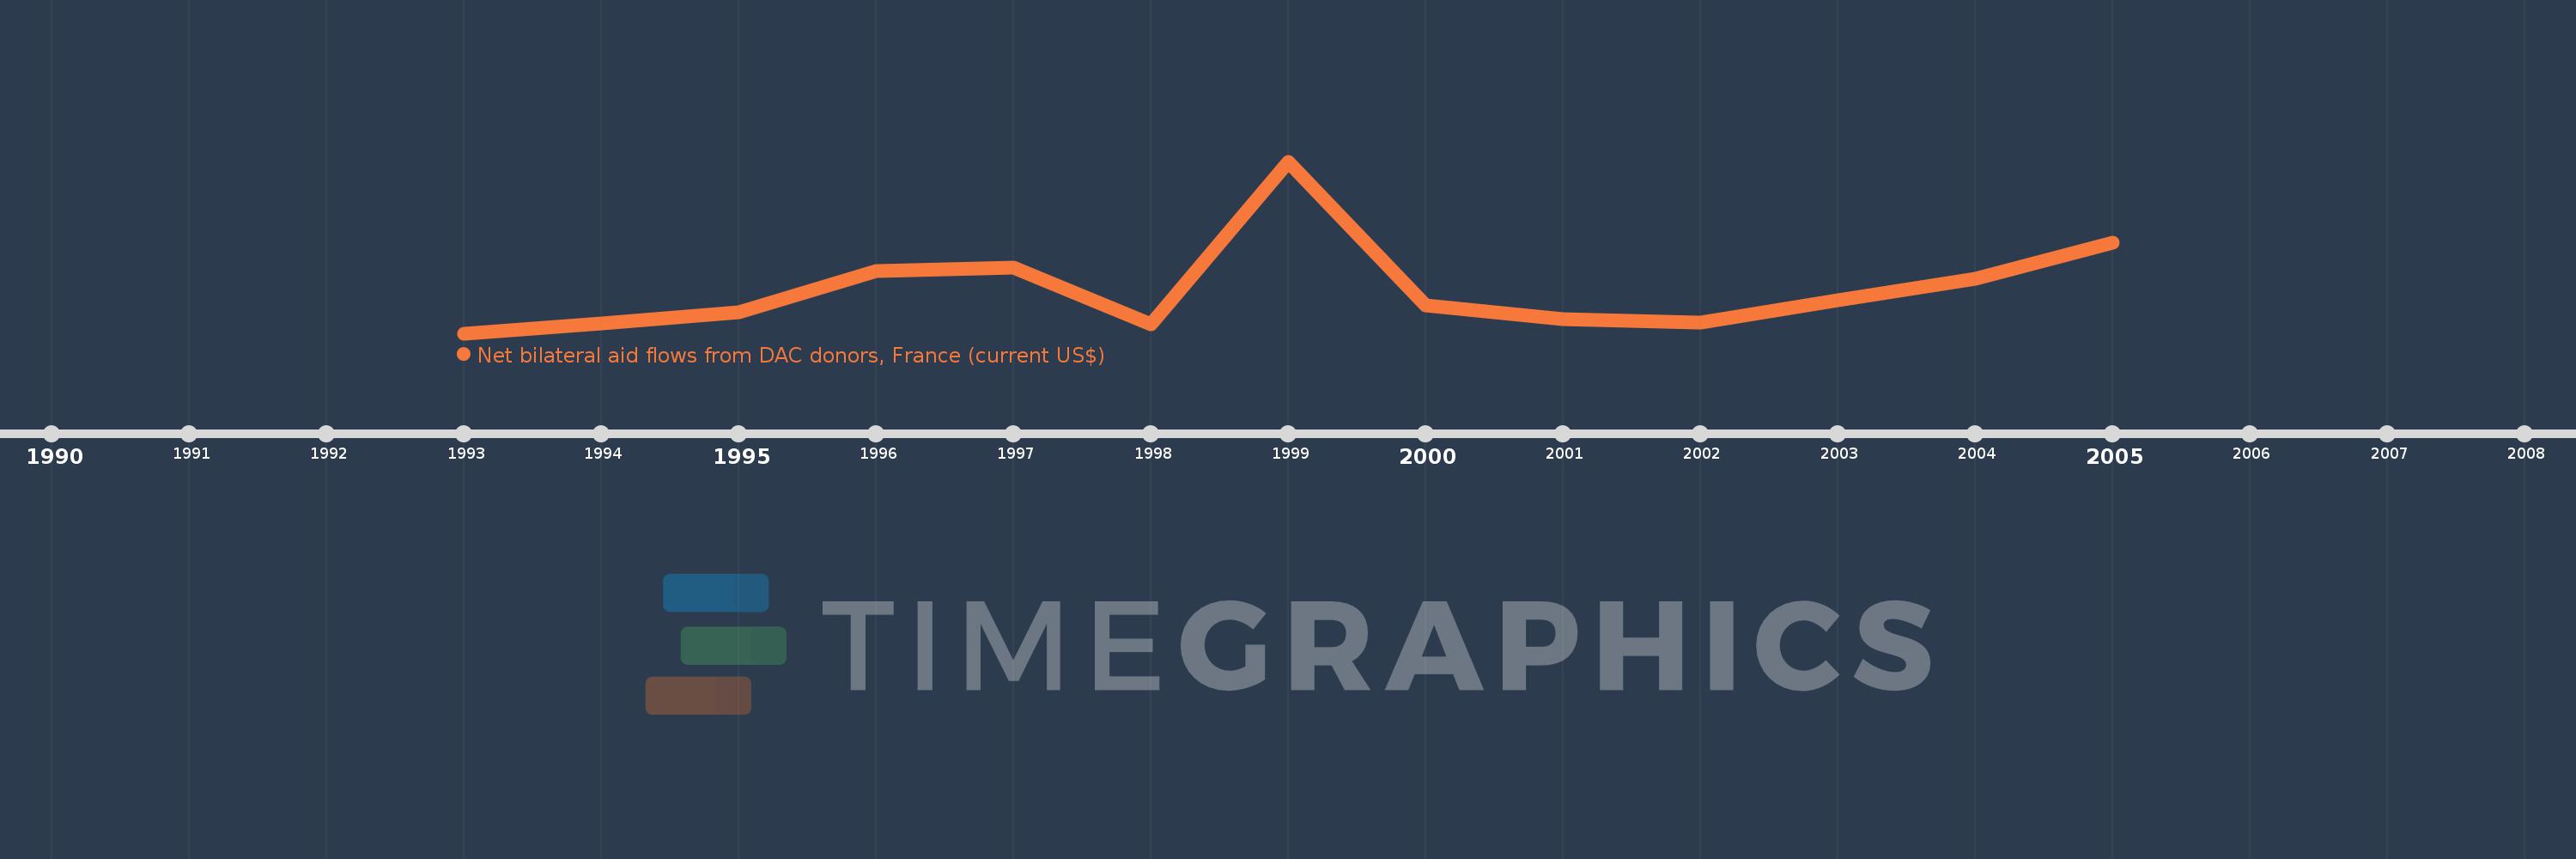
This timeline shows a graph from 1993 to 2005 of Lithuania. No data until 1992. Number of actual observations by date: 13.
Source name:
World Development Indicators
Source organization:
Development Assistance Committee of the Organisation for Economic Co-operation and Development, Geographical Distribution of Financial Flows to Developing Countries, Development Co-operation Report, and International Development Statistics database. Data are available online at: www.oecd.org/dac/stats/idsonline.
Categories, topics:
Aid Effectiveness
Last updated:
apr 23, 2017
Indicators value changes by year
Meaning:
2.343 mln
Minimum:
1.02 mln
jan 1, 1993
Maximum:
6.2 mln
jan 1, 1999
At the date of observation
Value
Absolute change
Change from the previous value
jan 1, 1993
1.02 mln
+1.02 mln
0.0%
jan 1, 1994
1.32 mln
+300.0K
29.41%
jan 1, 1995
1.65 mln
+330.0K
25.0%
jan 1, 1996
2.9 mln
+1.25 mln
75.76%
jan 1, 1997
3.0 mln
+100.0K
3.45%
jan 1, 1998
1.29 mln
-1.71 mln
-57.0%
jan 1, 1999
6.2 mln
+4.91 mln
380.62%
jan 1, 2000
1.85 mln
-4.35 mln
-70.16%
jan 1, 2001
1.45 mln
-400.0K
-21.62%
jan 1, 2002
1.34 mln
-110.0K
-7.59%
jan 1, 2003
2.03 mln
+690.0K
51.49%
jan 1, 2004
2.67 mln
+640.0K
31.53%
jan 1, 2005
3.74 mln
+1.07 mln
40.07%
Ranking of countries by current statistics by years