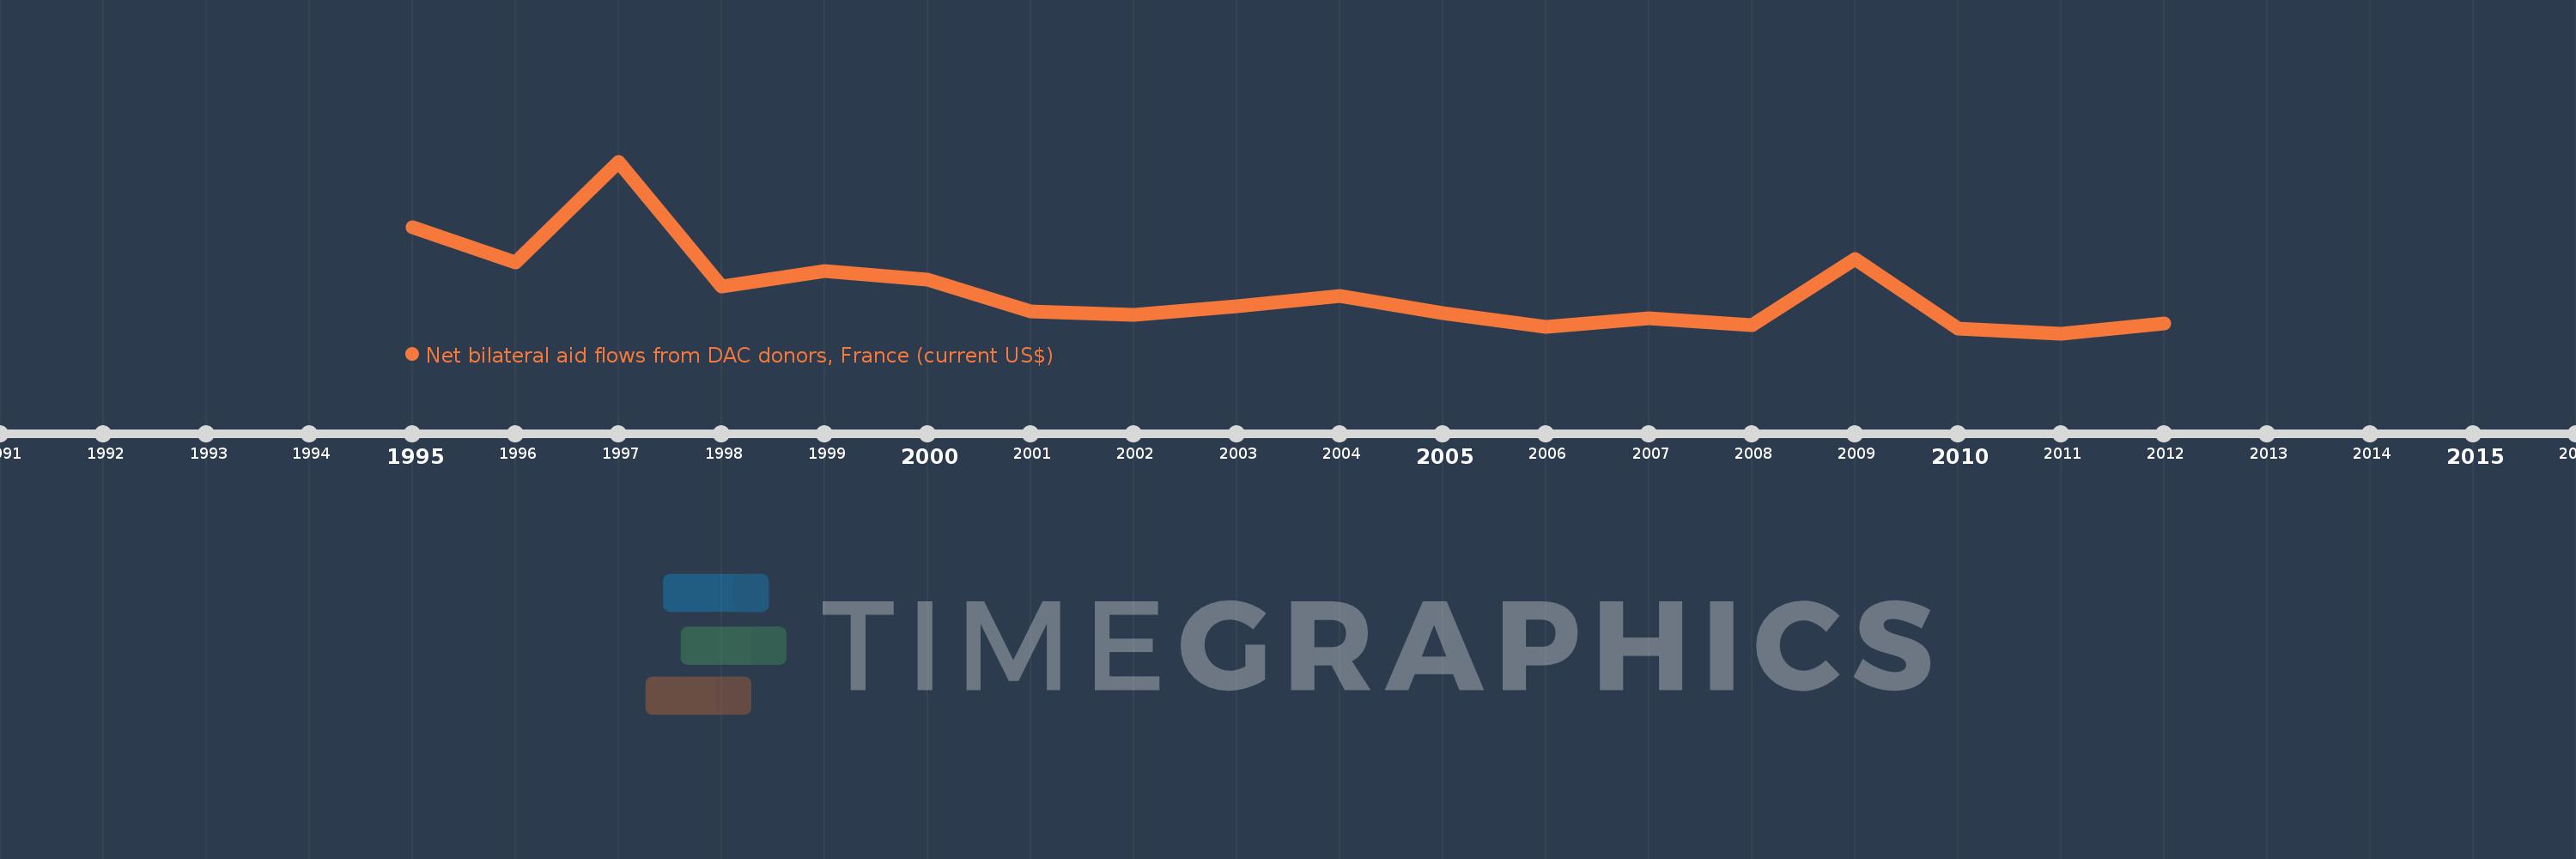
This timeline shows a graph from 1995 to 2012 of St. Kitts and Nevis. No data until 1994. Number of actual observations by date: 18.
Source name:
World Development Indicators
Source organization:
Development Assistance Committee of the Organisation for Economic Co-operation and Development, Geographical Distribution of Financial Flows to Developing Countries, Development Co-operation Report, and International Development Statistics database. Data are available online at: www.oecd.org/dac/stats/idsonline.
Categories, topics:
Aid Effectiveness
Last updated:
apr 23, 2017
Indicators value changes by year
Meaning:
169.444K
Minimum:
-80.0K
jan 1, 2011
Maximum:
940.0K
jan 1, 1997
At the date of observation
Value
Absolute change
Change from the previous value
jan 1, 1995
550.0K
+550.0K
0.0%
jan 1, 1996
340.0K
-210.0K
-38.18%
jan 1, 1997
940.0K
+600.0K
176.47%
jan 1, 1998
200.0K
-740.0K
-78.72%
jan 1, 1999
290.0K
+90.0K
45.0%
jan 1, 2000
240.0K
-50.0K
-17.24%
jan 1, 2001
50.0K
-190.0K
-79.17%
jan 1, 2002
30.0K
-20.0K
-40.0%
jan 1, 2003
80.0K
+50.0K
166.67%
jan 1, 2004
140.0K
+60.0K
75.0%
jan 1, 2005
40.0K
-100.0K
-71.43%
jan 1, 2006
-40.0K
-80.0K
-200.0%
jan 1, 2007
10.0K
+50.0K
-125.0%
jan 1, 2008
-30.0K
-40.0K
-400.0%
jan 1, 2009
360.0K
+390.0K
-1.3K%
jan 1, 2010
-50.0K
-410.0K
-113.89%
jan 1, 2011
-80.0K
-30.0K
60.0%
jan 1, 2012
-20.0K
+60.0K
-75.0%
Ranking of countries by current statistics by years