Download This statistics in other country:
Timeline:
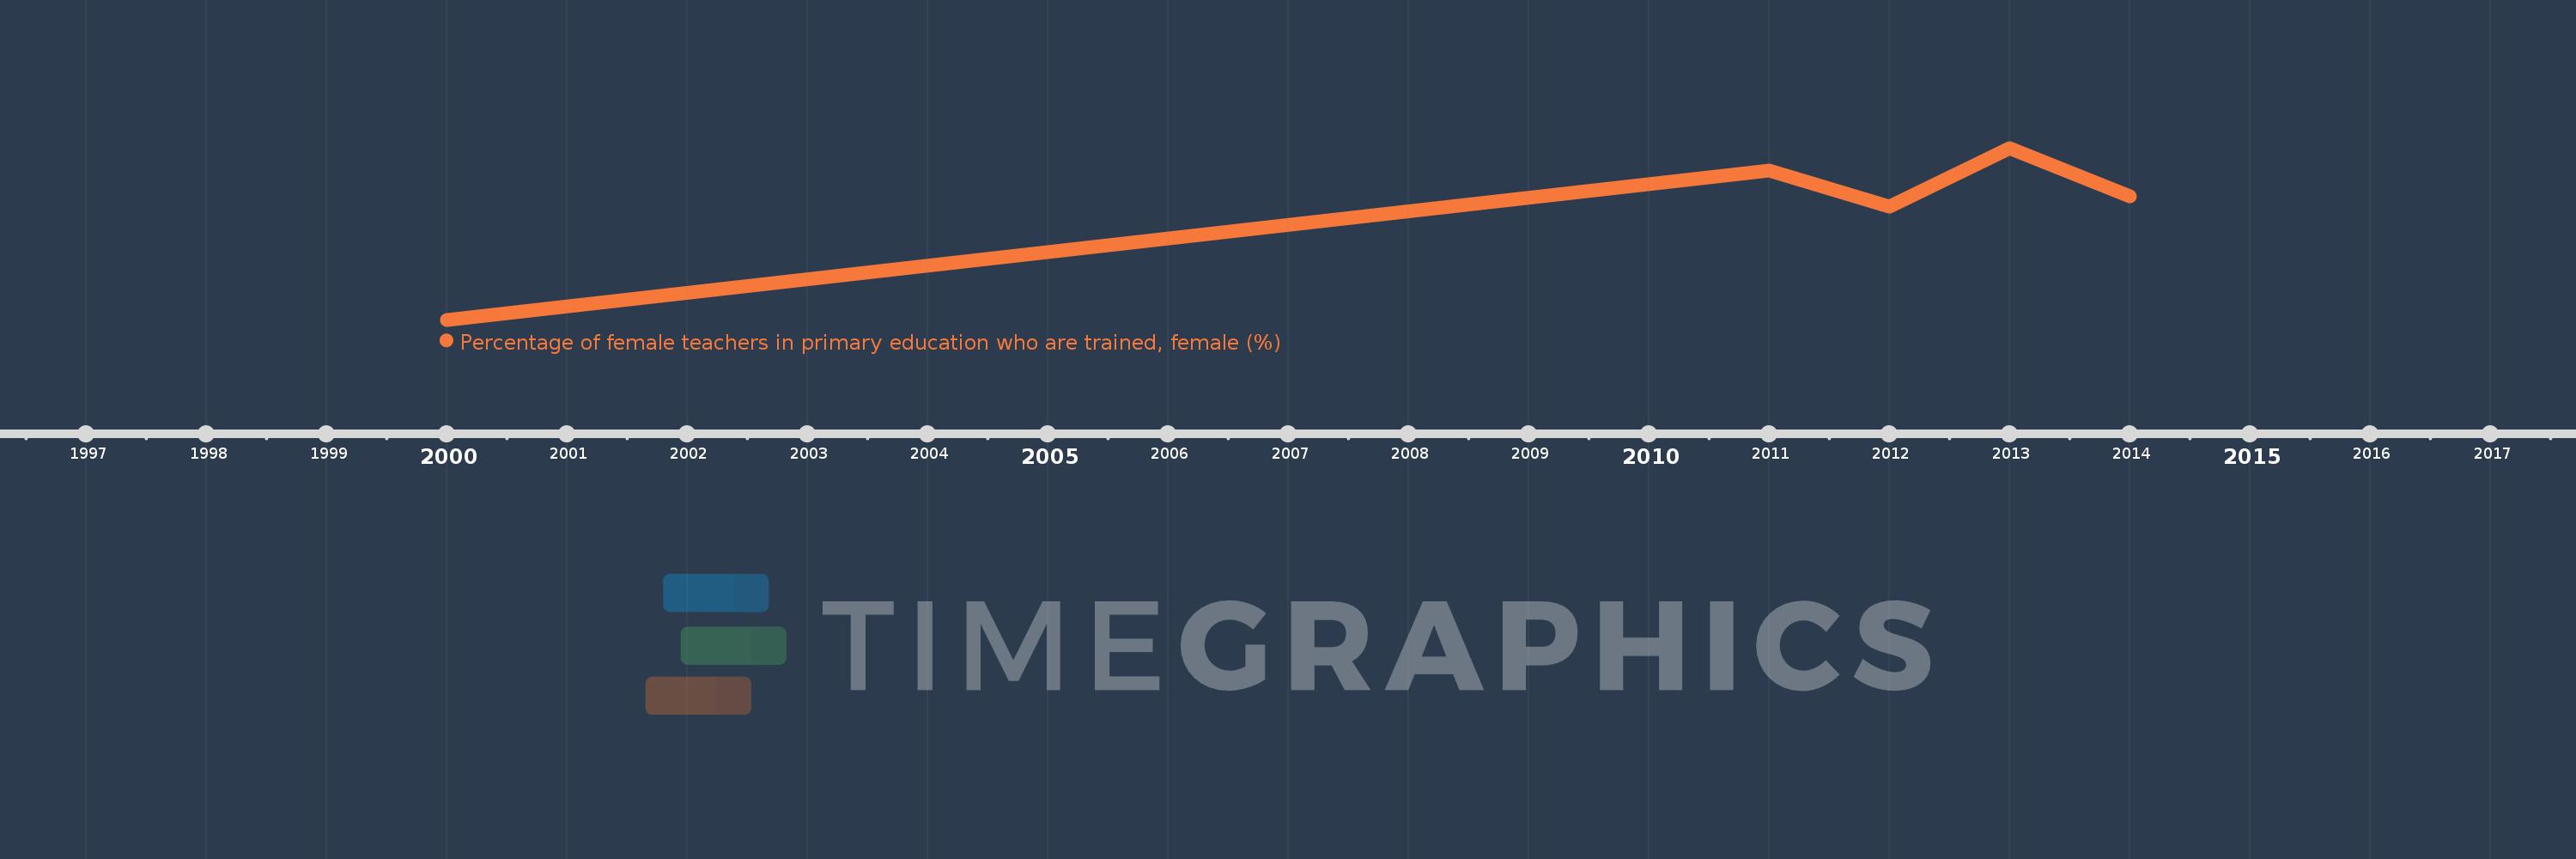
This timeline shows a graph from 2000 to 2014 of Togo. No data until 1999. Number of actual observations by date: 5.
Source name:
World Development Indicators
Source organization:
United Nations Educational, Scientific, and Cultural Organization (UNESCO) Institute for Statistics.
Categories, topics:
Education, Gender
Last updated:
apr 23, 2017
Indicators value changes by year
Minimum:
45.884
jan 1, 2000
Maximum:
78.424
jan 1, 2013
At the date of observation
Value
Absolute change
Change from the previous value
jan 1, 2000
45.884
+45.884
0.0%
jan 1, 2011
74.16
+28.275
61.62%
jan 1, 2012
67.332
-6.828
-9.21%
jan 1, 2013
78.424
+11.092
16.47%
jan 1, 2014
69.193
-9.231
-11.77%
Ranking of countries by current statistics by years