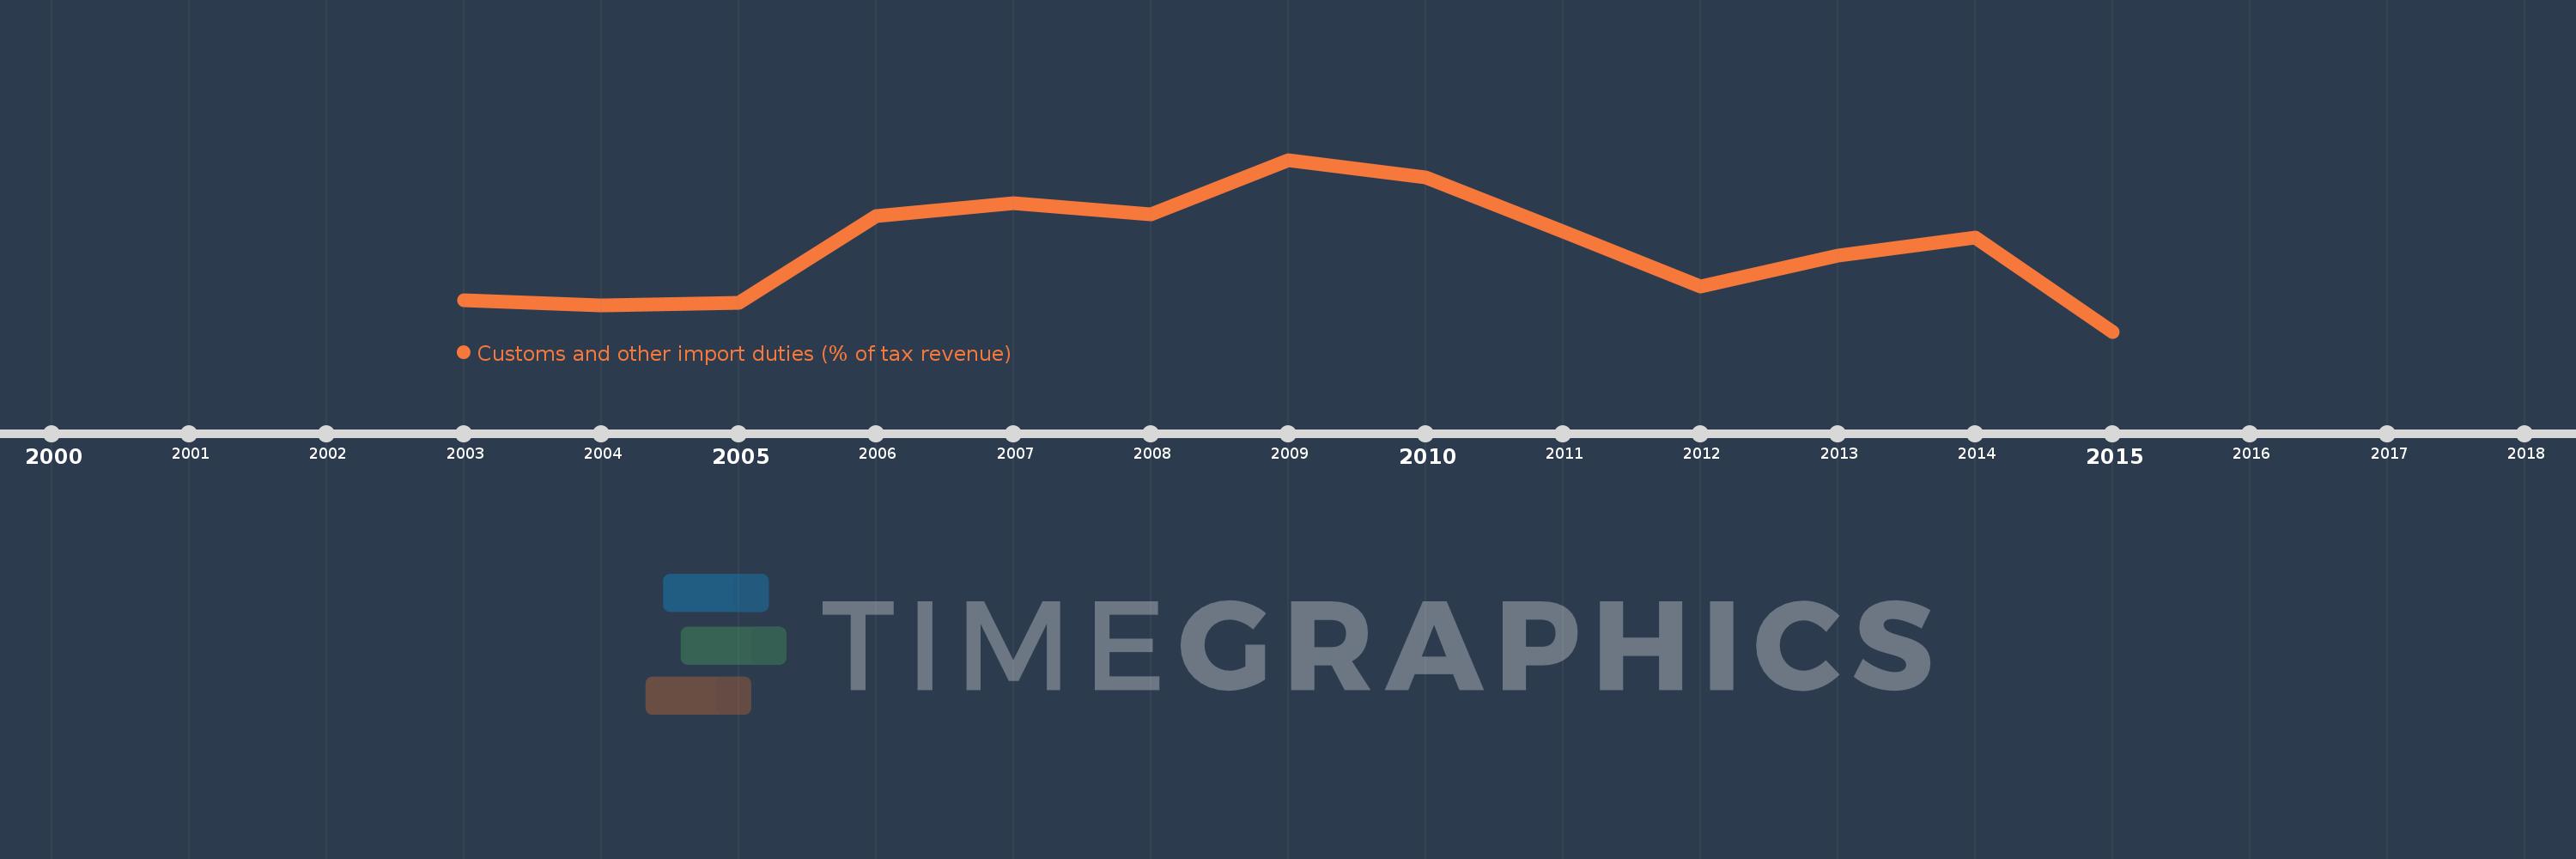
Questa scala temporale mostra un grafico dal 2003 anno al 2015 anno. Burkina Faso. I dati fino ad 2002 anno non disponibili. Il numero di osservazioni attuali secondo i date: 13.
La fonte (nome):
Indicatori dello sviluppo mondiale
La fonte (organizzazione):
International Monetary Fund, Government Finance Statistics Yearbook and data files.
Categorie:
Public Sector, Trade
sono stati aggiornati
23 apr 2017 anni
Indicatori delle variazioni dei valori per anni
In media:
16.717
Minima:
15.197
1 gen 2015 anni
Massimo:
18.313
1 gen 2009 anni
Alla data di osservazione
Valore
Variazione assoluta
La variazione rispetto al valore precedente
1 gen 2003 anni
15.772
+15.772
0.0%
1 gen 2004 anni
15.673
-0.099
-0.63%
1 gen 2005 anni
15.722
+0.049
0.31%
1 gen 2006 anni
17.287
+1.565
9.96%
1 gen 2007 anni
17.523
+0.236
1.36%
1 gen 2008 anni
17.32
-0.203
-1.16%
1 gen 2009 anni
18.313
+0.993
5.73%
1 gen 2010 anni
18.0
-0.313
-1.71%
1 gen 2011 anni
17.019
-0.981
-5.45%
1 gen 2012 anni
16.018
-1.001
-5.88%
1 gen 2013 anni
16.575
+0.556
3.47%
1 gen 2014 anni
16.902
+0.327
1.97%
1 gen 2015 anni
15.197
-1.705
-10.09%
Classificazione dei paesi secondo i statistiche attuali per anni