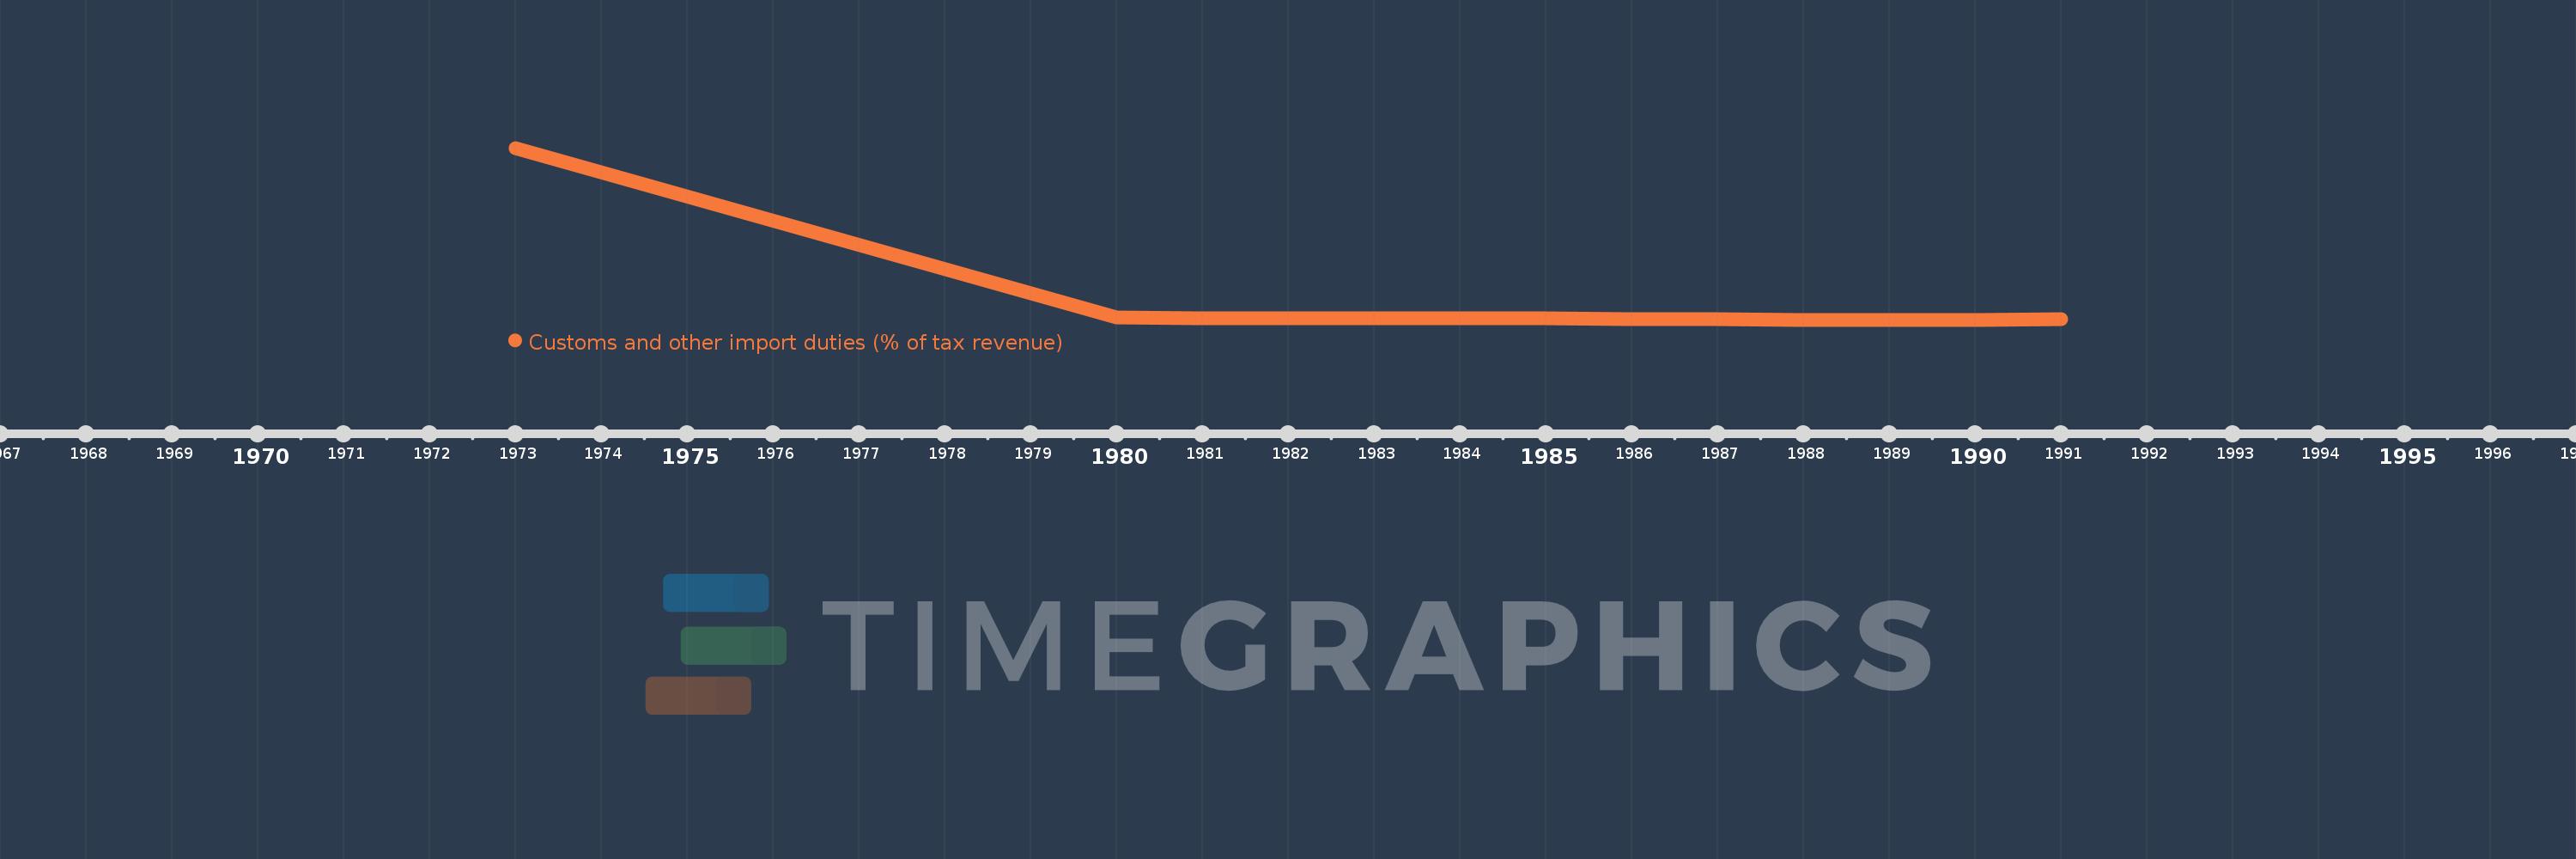
Questa scala temporale mostra un grafico dal 1973 anno al 1991 anno. Denmark. I dati fino ad 1972 anno non disponibili. Il numero di osservazioni attuali secondo i date: 13.
La fonte (nome):
Indicatori dello sviluppo mondiale
La fonte (organizzazione):
International Monetary Fund, Government Finance Statistics Yearbook and data files.
Categorie:
Public Sector, Trade
sono stati aggiornati
23 apr 2017 anni
Indicatori delle variazioni dei valori per anni
In media:
0.346
Minima:
0.066
1 gen 1988 anni
Massimo:
3.5
1 gen 1973 anni
Alla data di osservazione
Valore
Variazione assoluta
La variazione rispetto al valore precedente
1 gen 1973 anni
3.5
+3.5
0.0%
1 gen 1980 anni
0.109
-3.391
-96.9%
1 gen 1981 anni
0.101
-0.008
-7.4%
1 gen 1982 anni
0.088
-0.012
-12.33%
1 gen 1983 anni
0.089
+0.001
1.44%
1 gen 1984 anni
0.089
-0.001
-0.67%
1 gen 1985 anni
0.092
+0.004
3.96%
1 gen 1986 anni
0.082
-0.01
-11.25%
1 gen 1987 anni
0.077
-0.005
-5.89%
1 gen 1988 anni
0.066
-0.011
-14.53%
1 gen 1989 anni
0.067
+0.001
2.16%
1 gen 1990 anni
0.068
+0.001
1.27%
1 gen 1991 anni
0.07
+0.002
2.6%
Classificazione dei paesi secondo i statistiche attuali per anni