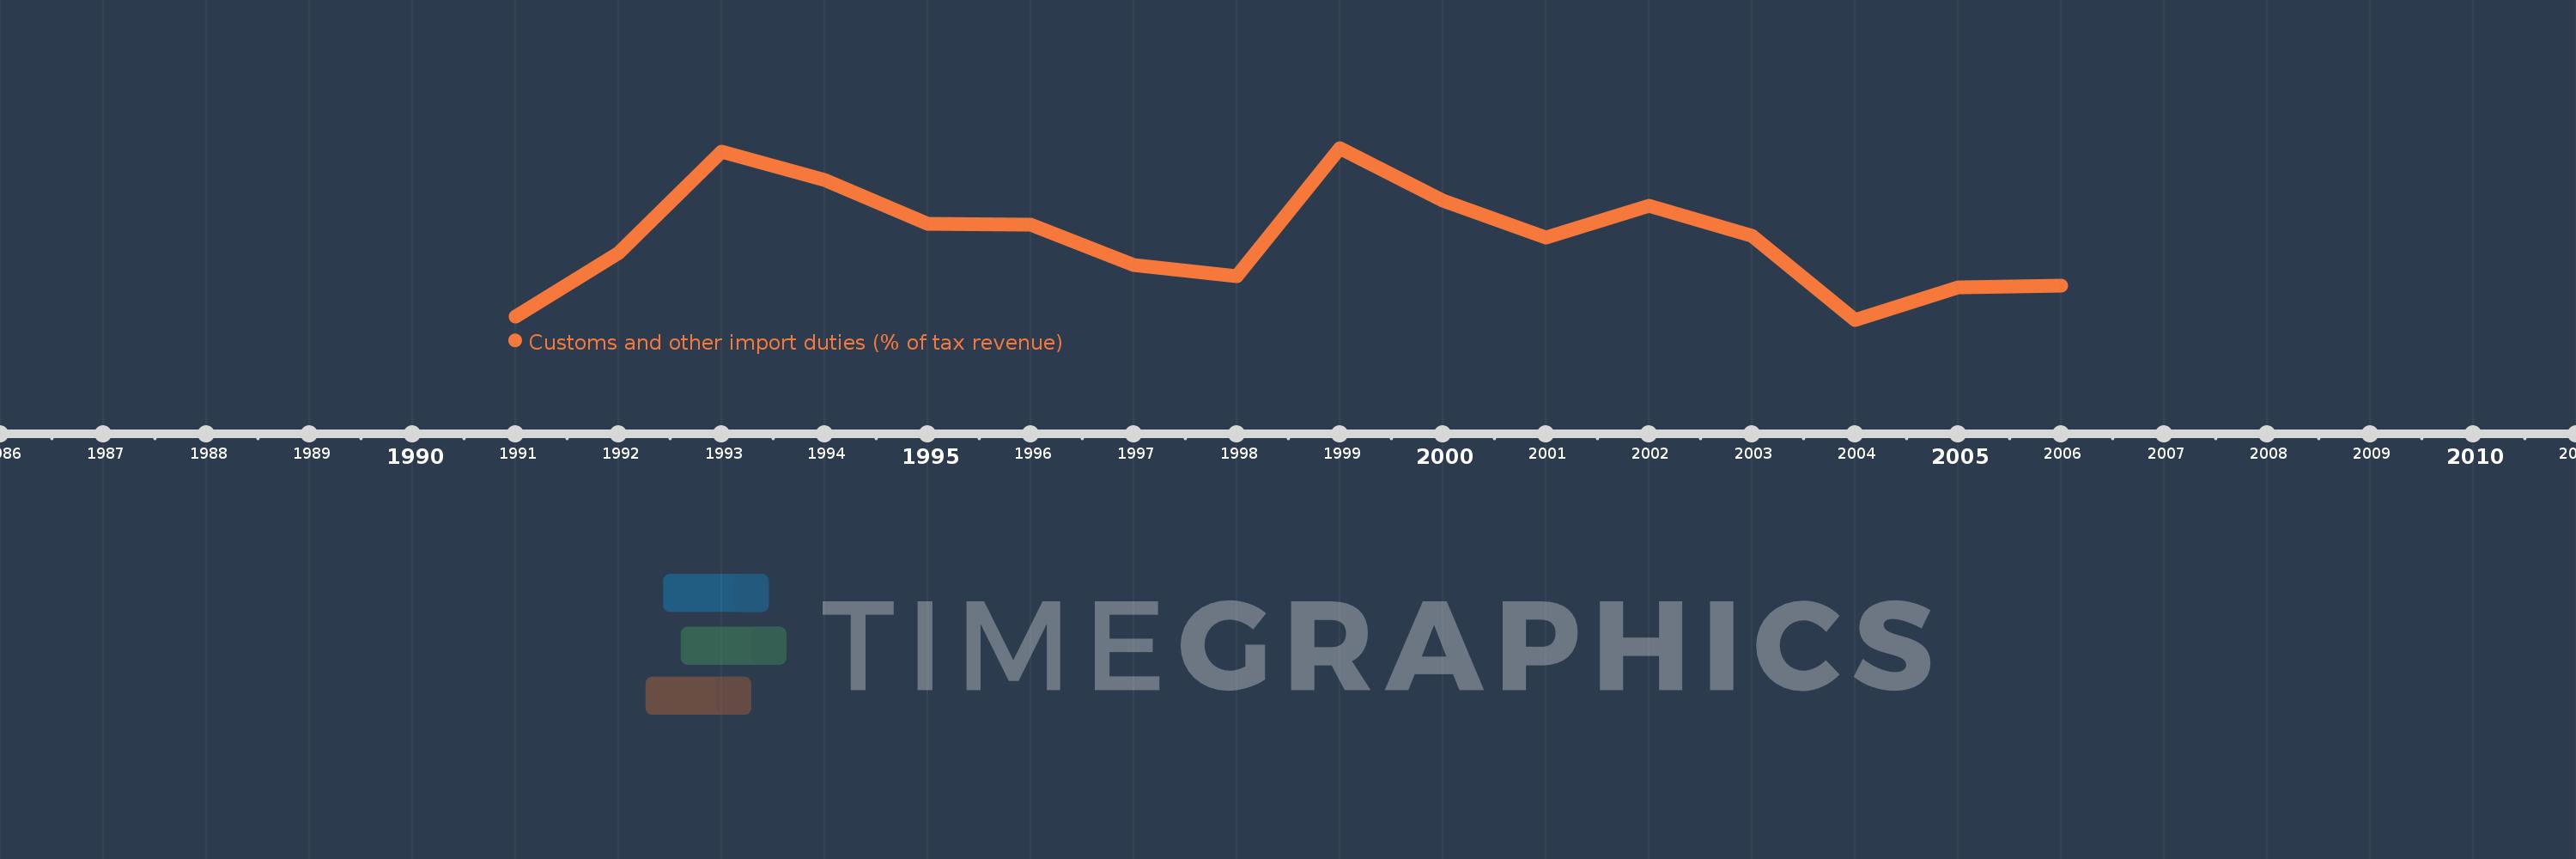
Questa scala temporale mostra un grafico dal 1991 anno al 2006 anno. Venezuela, RB. I dati fino ad 1990 anno non disponibili. Il numero di osservazioni attuali secondo i date: 16.
La fonte (nome):
Indicatori dello sviluppo mondiale
La fonte (organizzazione):
International Monetary Fund, Government Finance Statistics Yearbook and data files.
Categorie:
Public Sector, Trade
sono stati aggiornati
23 apr 2017 anni
Indicatori delle variazioni dei valori per anni
In media:
11.333
Minima:
7.345
1 gen 2004 anni
Massimo:
15.752
1 gen 1999 anni
Alla data di osservazione
Valore
Variazione assoluta
La variazione rispetto al valore precedente
1 gen 1991 anni
7.511
+7.511
0.0%
1 gen 1992 anni
10.592
+3.081
41.02%
1 gen 1993 anni
15.565
+4.973
46.95%
1 gen 1994 anni
14.197
-1.367
-8.79%
1 gen 1995 anni
12.023
-2.174
-15.32%
1 gen 1996 anni
11.999
-0.024
-0.2%
1 gen 1997 anni
10.01
-1.989
-16.58%
1 gen 1998 anni
9.484
-0.526
-5.25%
1 gen 1999 anni
15.752
+6.268
66.09%
1 gen 2000 anni
13.173
-2.579
-16.38%
1 gen 2001 anni
11.369
-1.804
-13.7%
1 gen 2002 anni
12.918
+1.549
13.63%
1 gen 2003 anni
11.444
-1.473
-11.4%
1 gen 2004 anni
7.345
-4.099
-35.82%
1 gen 2005 anni
8.935
+1.59
21.65%
1 gen 2006 anni
9.008
+0.073
0.81%
Classificazione dei paesi secondo i statistiche attuali per anni