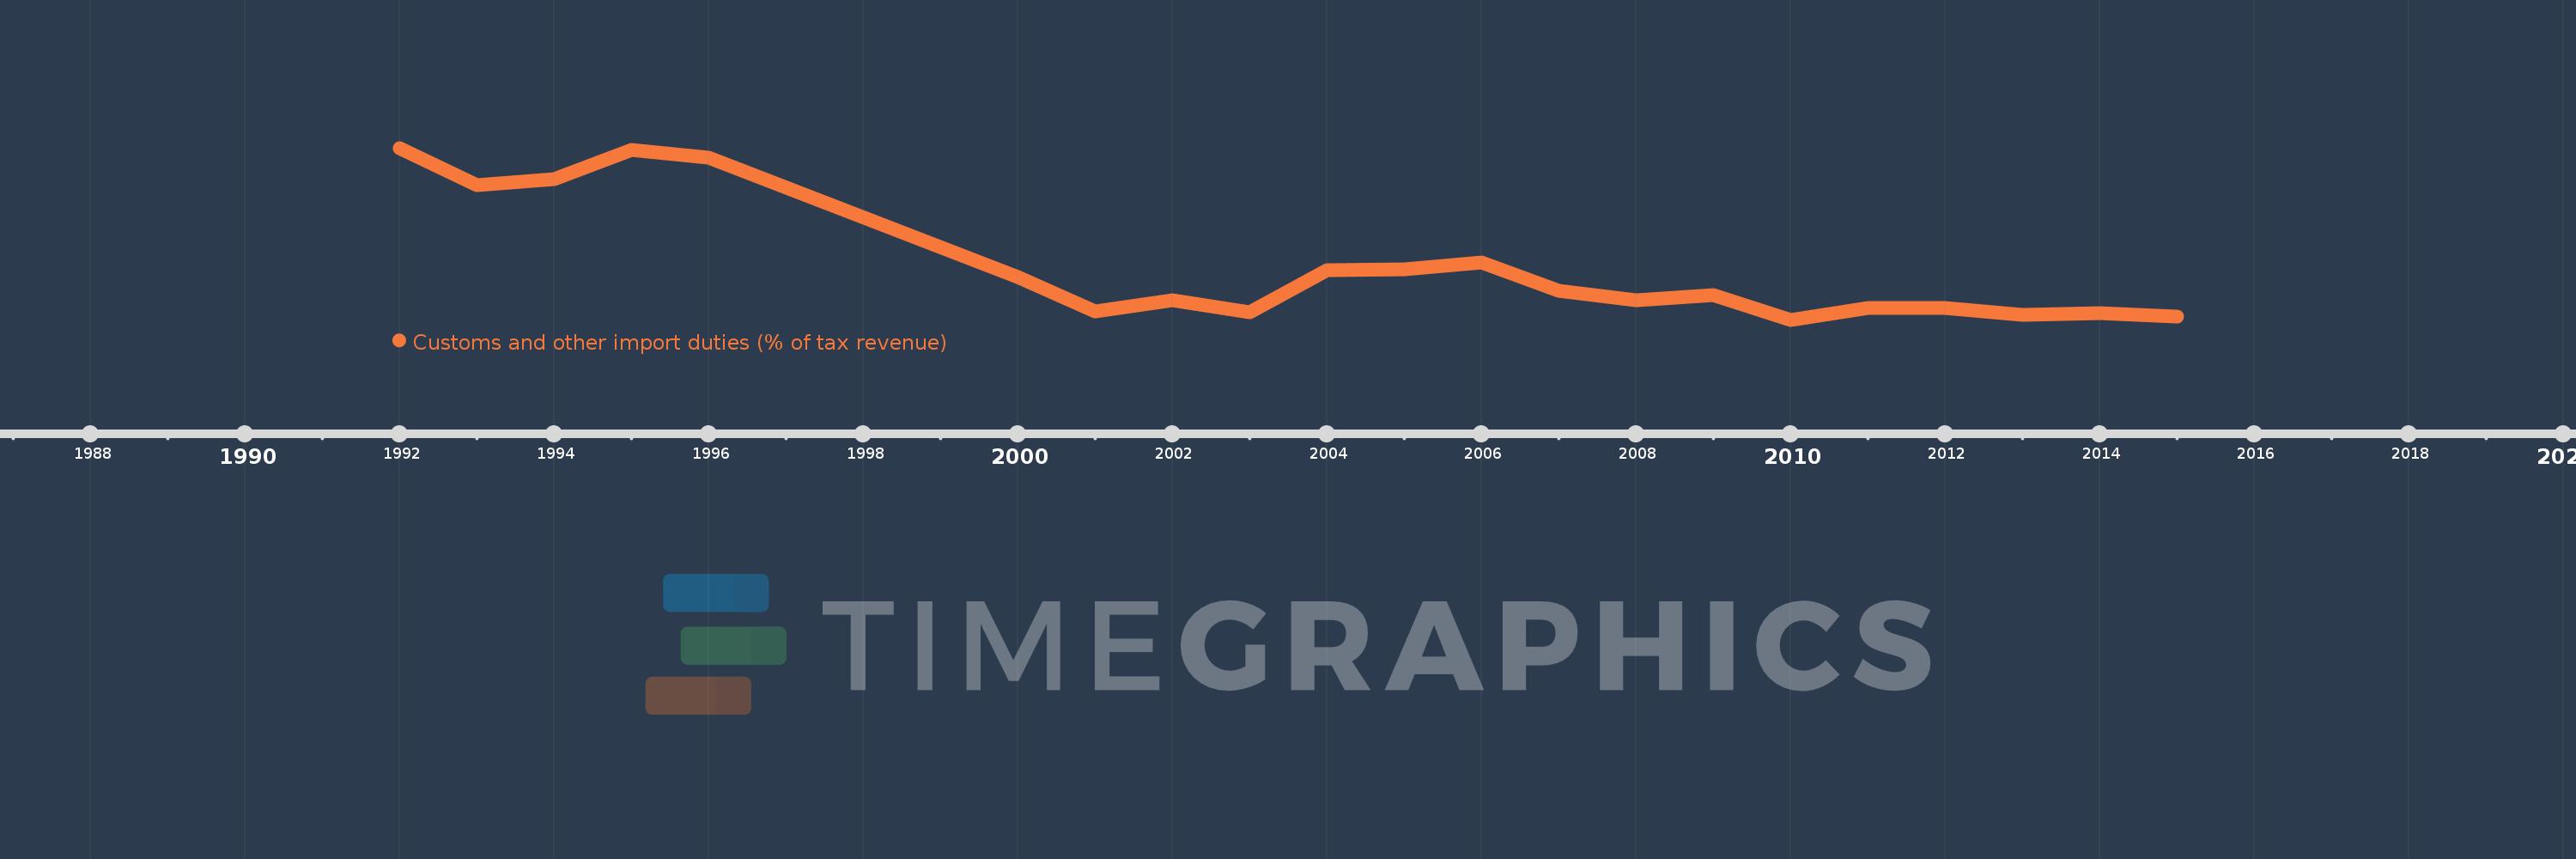
Questa scala temporale mostra un grafico dal 1992 anno al 2015 anno. Grenada. I dati fino ad 1991 anno non disponibili. Il numero di osservazioni attuali secondo i date: 21.
La fonte (nome):
Indicatori dello sviluppo mondiale
La fonte (organizzazione):
International Monetary Fund, Government Finance Statistics Yearbook and data files.
Categorie:
Public Sector, Trade
sono stati aggiornati
23 apr 2017 anni
Indicatori delle variazioni dei valori per anni
In media:
14.406
Minima:
11.665
1 gen 2010 anni
Massimo:
20.436
1 gen 1992 anni
Alla data di osservazione
Valore
Variazione assoluta
La variazione rispetto al valore precedente
1 gen 1992 anni
20.436
+20.436
0.0%
1 gen 1993 anni
18.549
-1.887
-9.23%
1 gen 1994 anni
18.856
+0.307
1.65%
1 gen 1995 anni
20.327
+1.471
7.8%
1 gen 1996 anni
19.959
-0.368
-1.81%
1 gen 2000 anni
13.836
-6.123
-30.68%
1 gen 2001 anni
12.103
-1.733
-12.52%
1 gen 2002 anni
12.649
+0.545
4.51%
1 gen 2003 anni
12.065
-0.584
-4.61%
1 gen 2004 anni
14.217
+2.152
17.84%
1 gen 2005 anni
14.251
+0.034
0.24%
1 gen 2006 anni
14.577
+0.326
2.29%
1 gen 2007 anni
13.131
-1.446
-9.92%
1 gen 2008 anni
12.655
-0.475
-3.62%
1 gen 2009 anni
12.918
+0.262
2.07%
1 gen 2010 anni
11.665
-1.253
-9.7%
1 gen 2011 anni
12.279
+0.614
5.26%
1 gen 2012 anni
12.285
+0.006
0.05%
1 gen 2013 anni
11.915
-0.37
-3.01%
1 gen 2014 anni
12.023
+0.108
0.91%
1 gen 2015 anni
11.828
-0.195
-1.62%
Classificazione dei paesi secondo i statistiche attuali per anni