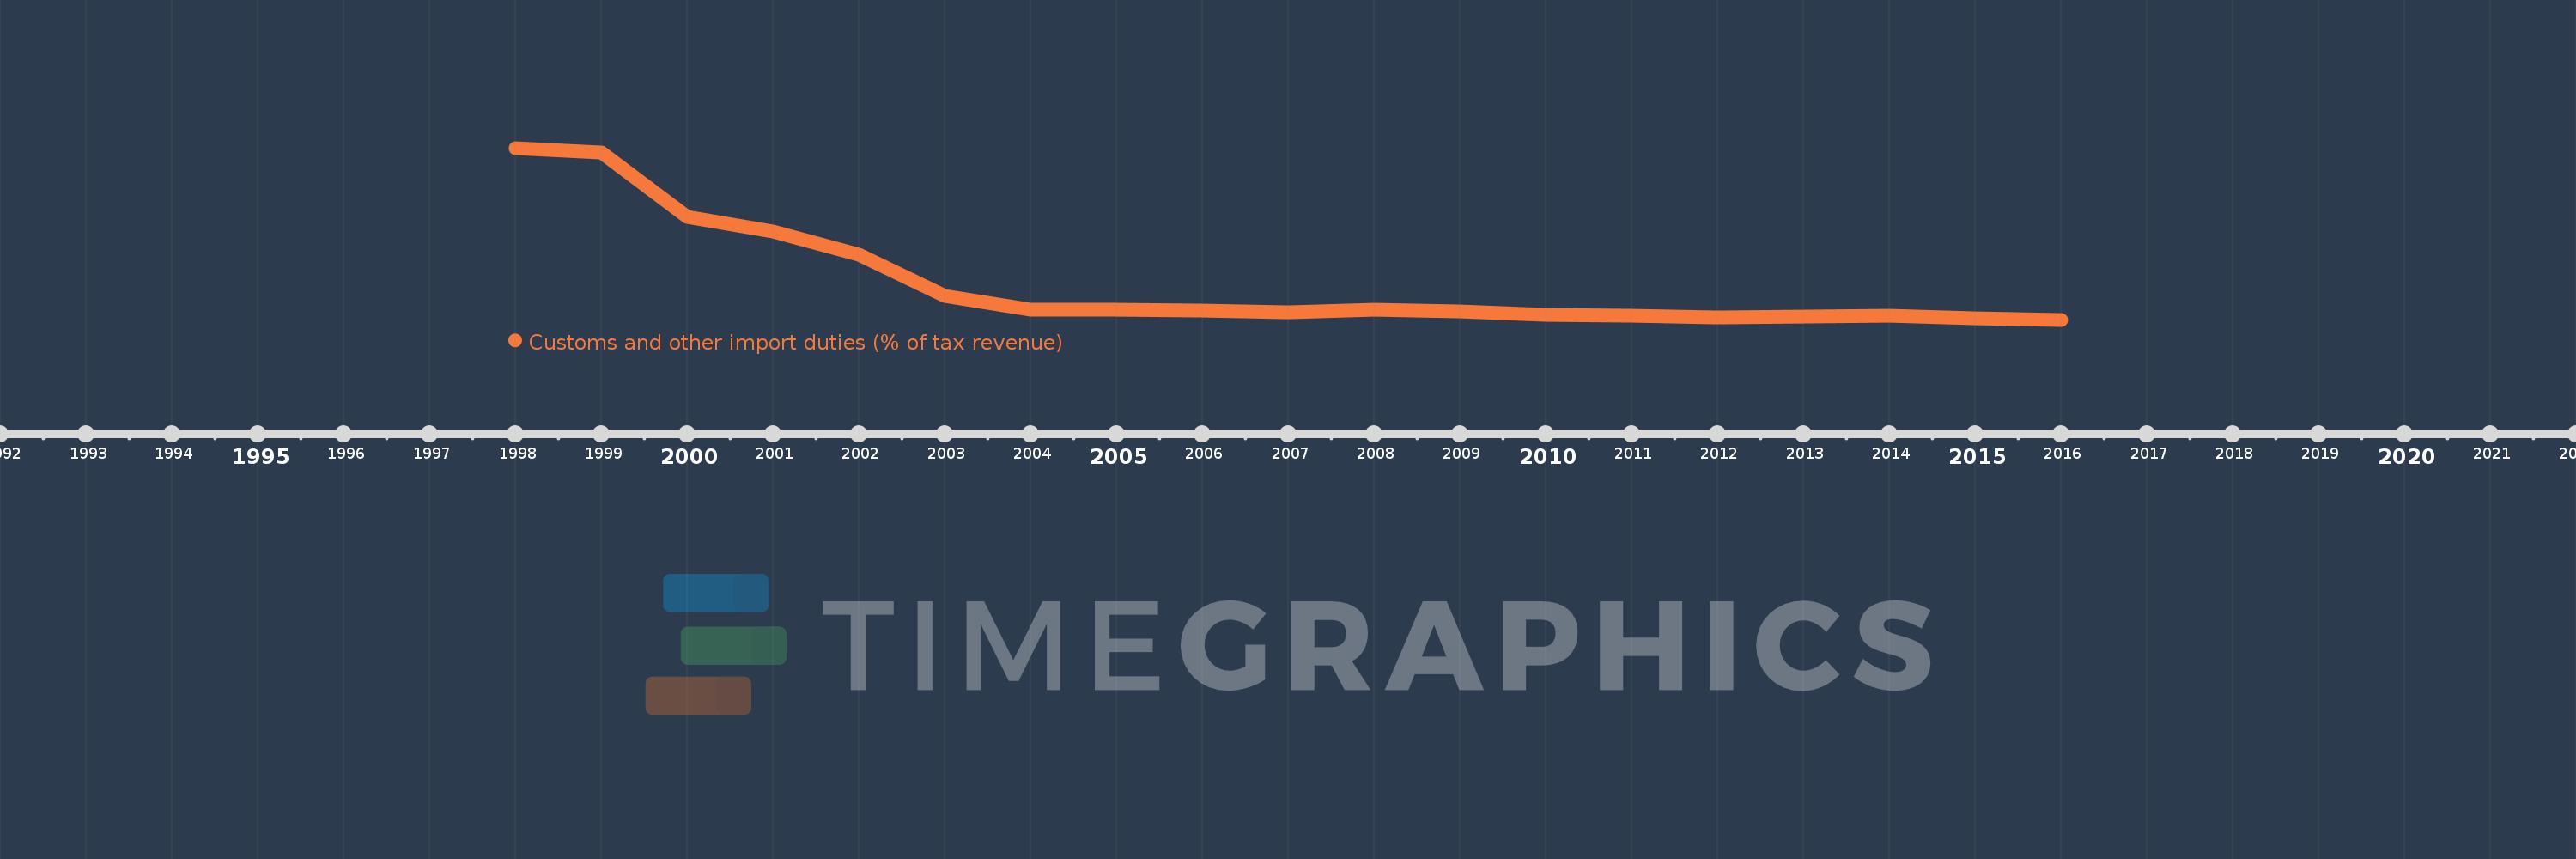
Questa scala temporale mostra un grafico dal 1998 anno al 2016 anno. Lebanon. I dati fino ad 1997 anno non disponibili. Il numero di osservazioni attuali secondo i date: 19.
La fonte (nome):
Indicatori dello sviluppo mondiale
La fonte (organizzazione):
International Monetary Fund, Government Finance Statistics Yearbook and data files.
Categorie:
Public Sector, Trade
sono stati aggiornati
23 apr 2017 anni
Indicatori delle variazioni dei valori per anni
In media:
18.317
Minima:
7.038
1 gen 2016 anni
Massimo:
60.178
1 gen 1998 anni
Alla data di osservazione
Valore
Variazione assoluta
La variazione rispetto al valore precedente
1 gen 1998 anni
60.178
+60.178
0.0%
1 gen 1999 anni
58.859
-1.319
-2.19%
1 gen 2000 anni
38.966
-19.893
-33.8%
1 gen 2001 anni
34.427
-4.539
-11.65%
1 gen 2002 anni
27.101
-7.326
-21.28%
1 gen 2003 anni
14.295
-12.806
-47.25%
1 gen 2004 anni
10.212
-4.083
-28.56%
1 gen 2005 anni
10.057
-0.155
-1.52%
1 gen 2006 anni
9.785
-0.272
-2.71%
1 gen 2007 anni
9.255
-0.53
-5.41%
1 gen 2008 anni
10.022
+0.767
8.29%
1 gen 2009 anni
9.514
-0.508
-5.07%
1 gen 2010 anni
8.54
-0.973
-10.23%
1 gen 2011 anni
8.295
-0.245
-2.87%
1 gen 2012 anni
7.879
-0.416
-5.02%
1 gen 2013 anni
7.896
+0.017
0.22%
1 gen 2014 anni
8.214
+0.318
4.03%
1 gen 2015 anni
7.487
-0.727
-8.86%
1 gen 2016 anni
7.038
-0.448
-5.98%
Classificazione dei paesi secondo i statistiche attuali per anni