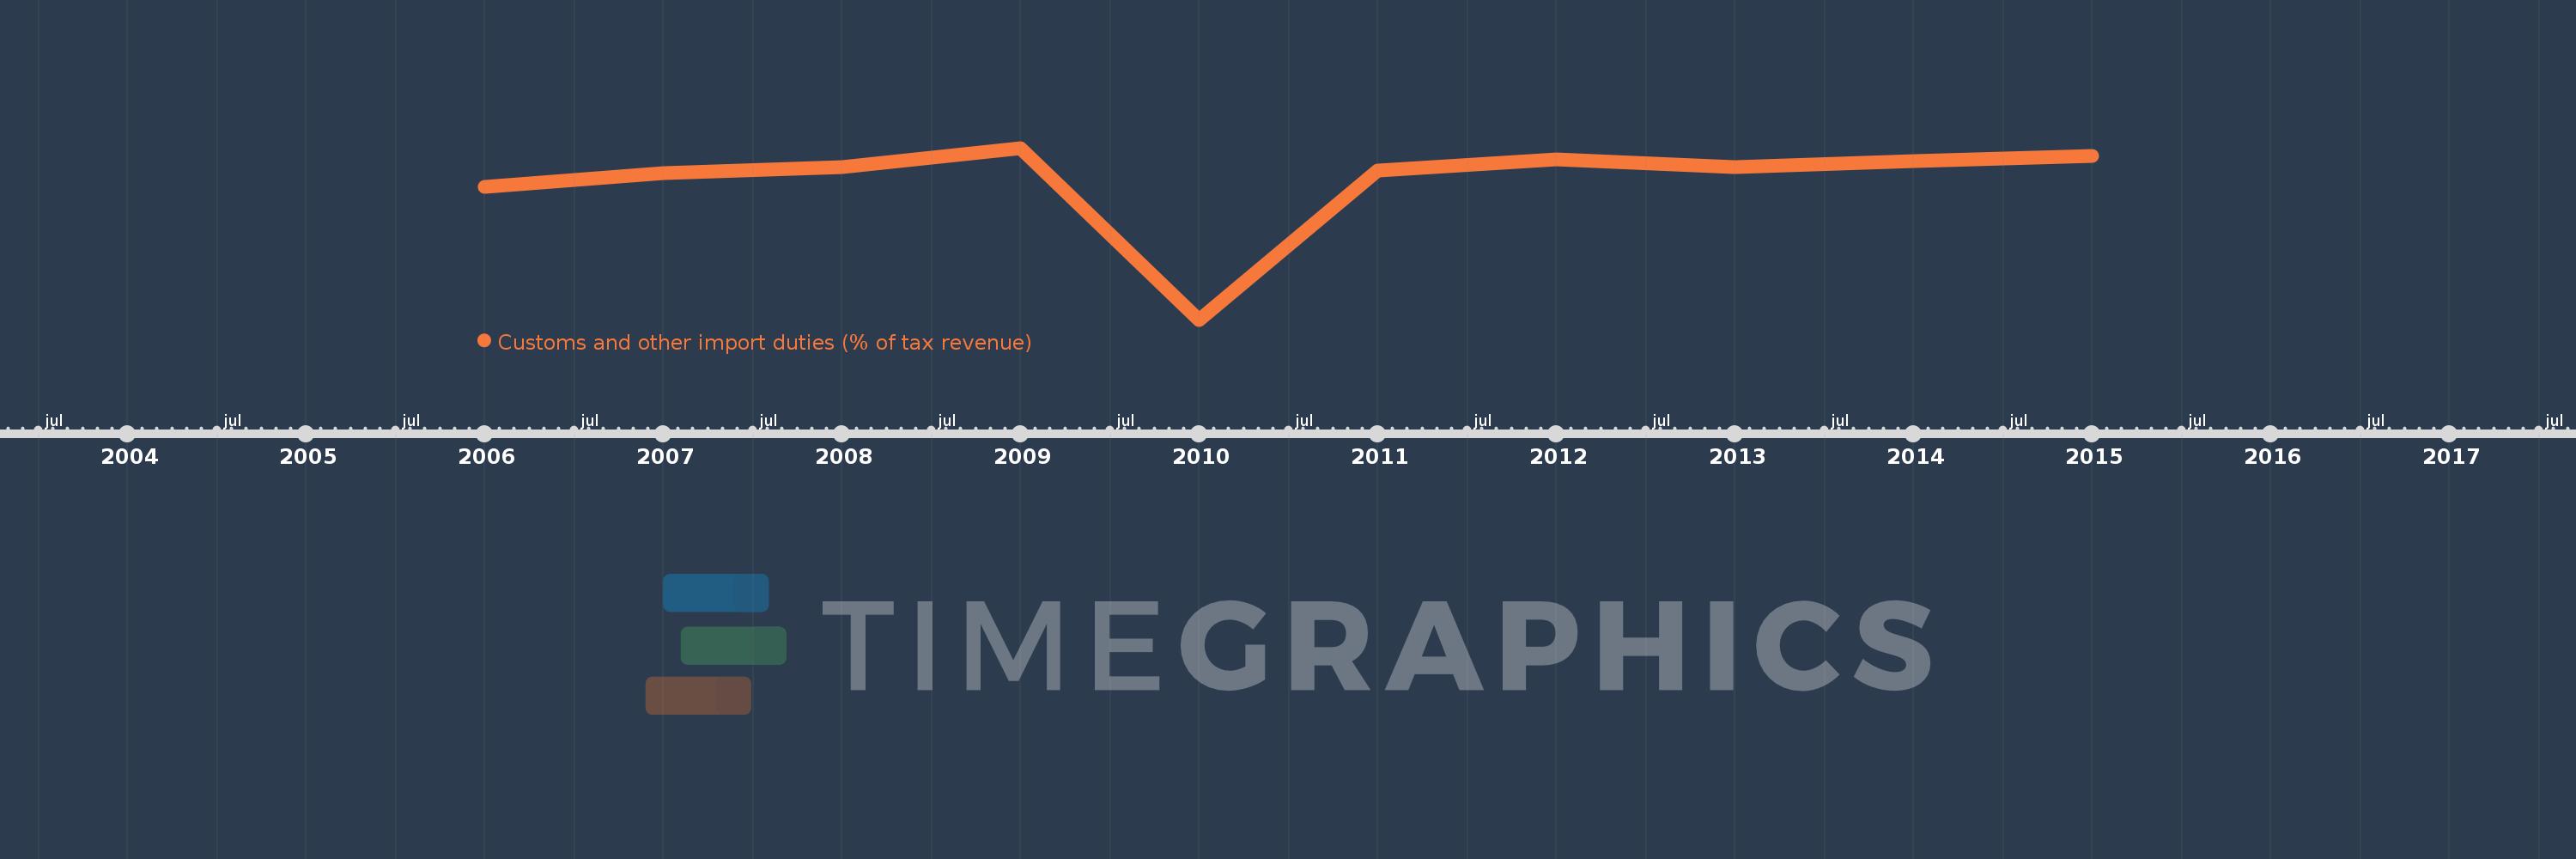
Questa scala temporale mostra un grafico dal 2006 anno al 2015 anno. West Bank and Gaza. I dati fino ad 2005 anno non disponibili. Il numero di osservazioni attuali secondo i date: 10.
La fonte (nome):
Indicatori dello sviluppo mondiale
La fonte (organizzazione):
International Monetary Fund, Government Finance Statistics Yearbook and data files.
Categorie:
Public Sector, Trade
sono stati aggiornati
23 apr 2017 anni
Indicatori delle variazioni dei valori per anni
In media:
25.527
Minima:
1.399
1 gen 2010 anni
Massimo:
31.224
1 gen 2009 anni
Alla data di osservazione
Valore
Variazione assoluta
La variazione rispetto al valore precedente
1 gen 2006 anni
24.448
+24.448
0.0%
1 gen 2007 anni
26.923
+2.475
10.12%
1 gen 2008 anni
27.958
+1.035
3.84%
1 gen 2009 anni
31.224
+3.266
11.68%
1 gen 2010 anni
1.399
-29.825
-95.52%
1 gen 2011 anni
27.371
+25.972
1.86 Mille.%
1 gen 2012 anni
29.186
+1.815
6.63%
1 gen 2013 anni
27.914
-1.272
-4.36%
1 gen 2014 anni
28.988
+1.074
3.85%
1 gen 2015 anni
29.858
+0.87
3.0%
Classificazione dei paesi secondo i statistiche attuali per anni