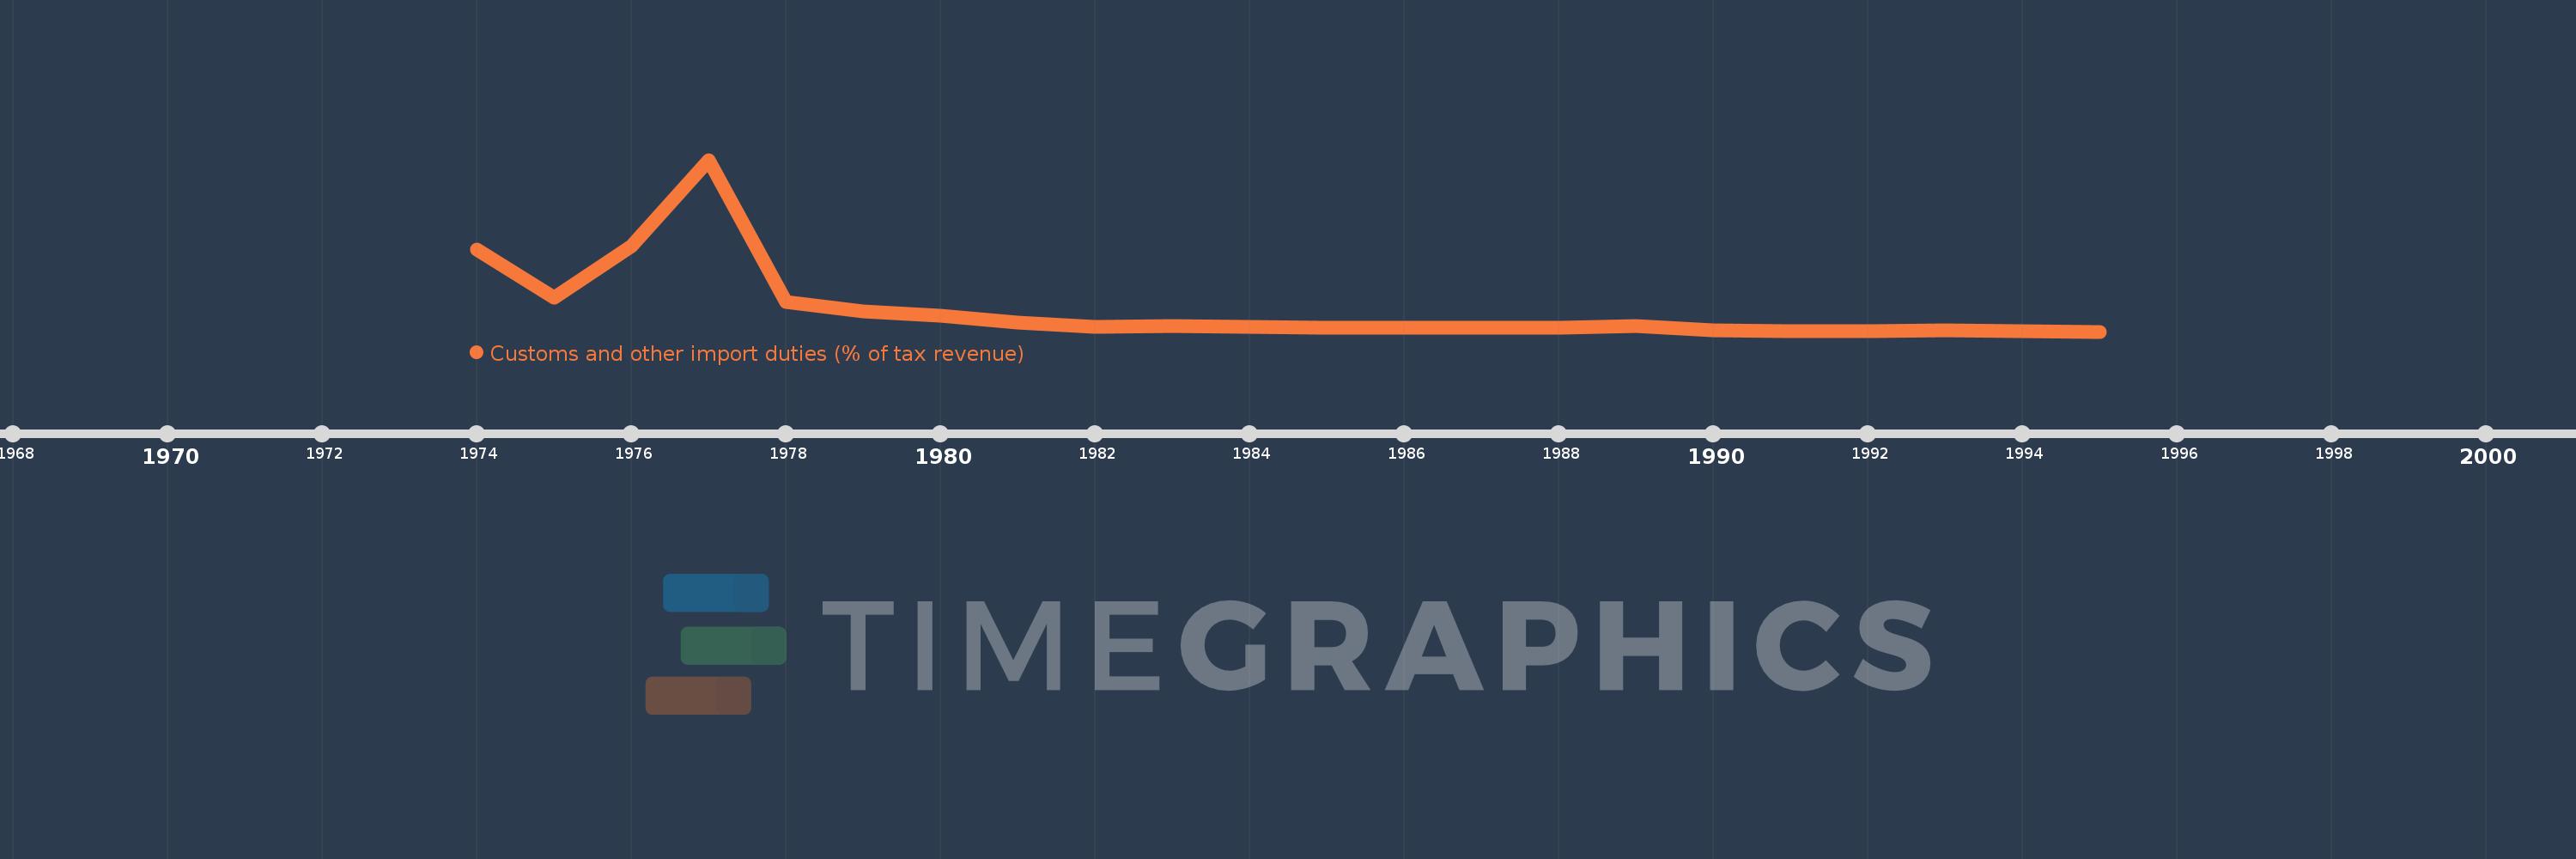
Questa scala temporale mostra un grafico dal 1974 anno al 1995 anno. Italy. I dati fino ad 1973 anno non disponibili. Il numero di osservazioni attuali secondo i date: 22.
La fonte (nome):
Indicatori dello sviluppo mondiale
La fonte (organizzazione):
International Monetary Fund, Government Finance Statistics Yearbook and data files.
Categorie:
Public Sector, Trade
sono stati aggiornati
23 apr 2017 anni
Indicatori delle variazioni dei valori per anni
In media:
0.2
Minima:
0.01
1 gen 1995 anni
Massimo:
1.478
1 gen 1977 anni
Alla data di osservazione
Valore
Variazione assoluta
La variazione rispetto al valore precedente
1 gen 1974 anni
0.709
+0.709
0.0%
1 gen 1975 anni
0.303
-0.406
-57.31%
1 gen 1976 anni
0.741
+0.438
144.85%
1 gen 1977 anni
1.478
+0.737
99.5%
1 gen 1978 anni
0.26
-1.218
-82.43%
1 gen 1979 anni
0.18
-0.08
-30.86%
1 gen 1980 anni
0.145
-0.034
-19.07%
1 gen 1981 anni
0.09
-0.055
-37.96%
1 gen 1982 anni
0.051
-0.04
-43.95%
1 gen 1983 anni
0.059
+0.008
16.58%
1 gen 1984 anni
0.049
-0.01
-16.42%
1 gen 1985 anni
0.045
-0.004
-8.04%
1 gen 1986 anni
0.045
+0.0
0.33%
1 gen 1987 anni
0.046
+0.001
1.9%
1 gen 1988 anni
0.041
-0.005
-10.49%
1 gen 1989 anni
0.056
+0.015
36.02%
1 gen 1990 anni
0.018
-0.038
-68.02%
1 gen 1991 anni
0.014
-0.004
-20.56%
1 gen 1992 anni
0.015
+0.001
7.42%
1 gen 1993 anni
0.021
+0.006
36.33%
1 gen 1994 anni
0.017
-0.004
-17.7%
1 gen 1995 anni
0.01
-0.007
-40.08%
Classificazione dei paesi secondo i statistiche attuali per anni