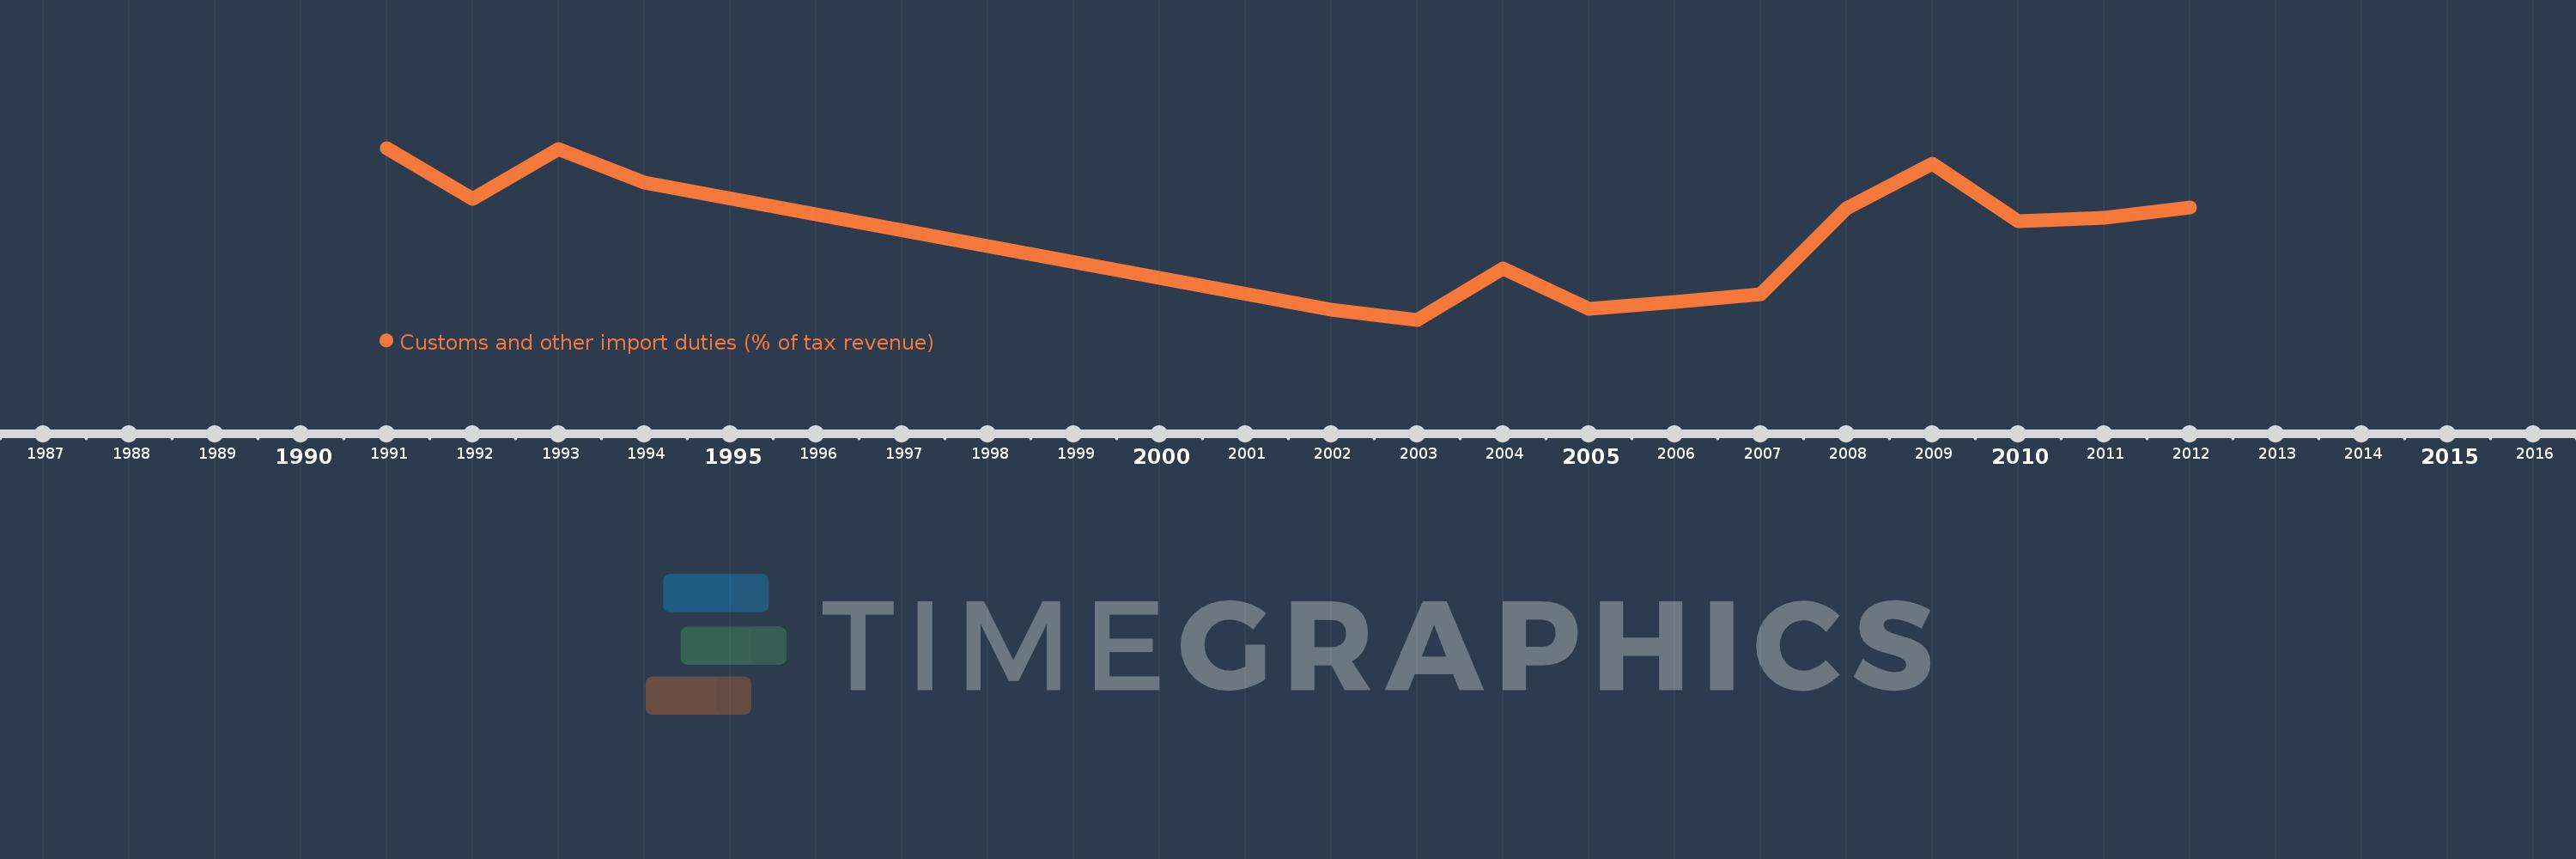
Questa scala temporale mostra un grafico dal 1991 anno al 2012 anno. Ghana. I dati fino ad 1990 anno non disponibili. Il numero di osservazioni attuali secondo i date: 15.
La fonte (nome):
Indicatori dello sviluppo mondiale
La fonte (organizzazione):
International Monetary Fund, Government Finance Statistics Yearbook and data files.
Categorie:
Public Sector, Trade
sono stati aggiornati
23 apr 2017 anni
Indicatori delle variazioni dei valori per anni
In media:
22.121
Minima:
15.396
1 gen 2003 anni
Massimo:
28.743
1 gen 1991 anni
Alla data di osservazione
Valore
Variazione assoluta
La variazione rispetto al valore precedente
1 gen 1991 anni
28.743
+28.743
0.0%
1 gen 1992 anni
24.809
-3.933
-13.68%
1 gen 1993 anni
28.685
+3.876
15.62%
1 gen 1994 anni
26.054
-2.632
-9.17%
1 gen 2002 anni
16.193
-9.861
-37.85%
1 gen 2003 anni
15.396
-0.797
-4.92%
1 gen 2004 anni
19.364
+3.968
25.77%
1 gen 2005 anni
16.246
-3.119
-16.11%
1 gen 2006 anni
16.778
+0.532
3.28%
1 gen 2007 anni
17.406
+0.628
3.74%
1 gen 2008 anni
24.082
+6.676
38.35%
1 gen 2009 anni
27.543
+3.462
14.37%
1 gen 2010 anni
23.059
-4.484
-16.28%
1 gen 2011 anni
23.327
+0.268
1.16%
1 gen 2012 anni
24.128
+0.802
3.44%
Classificazione dei paesi secondo i statistiche attuali per anni