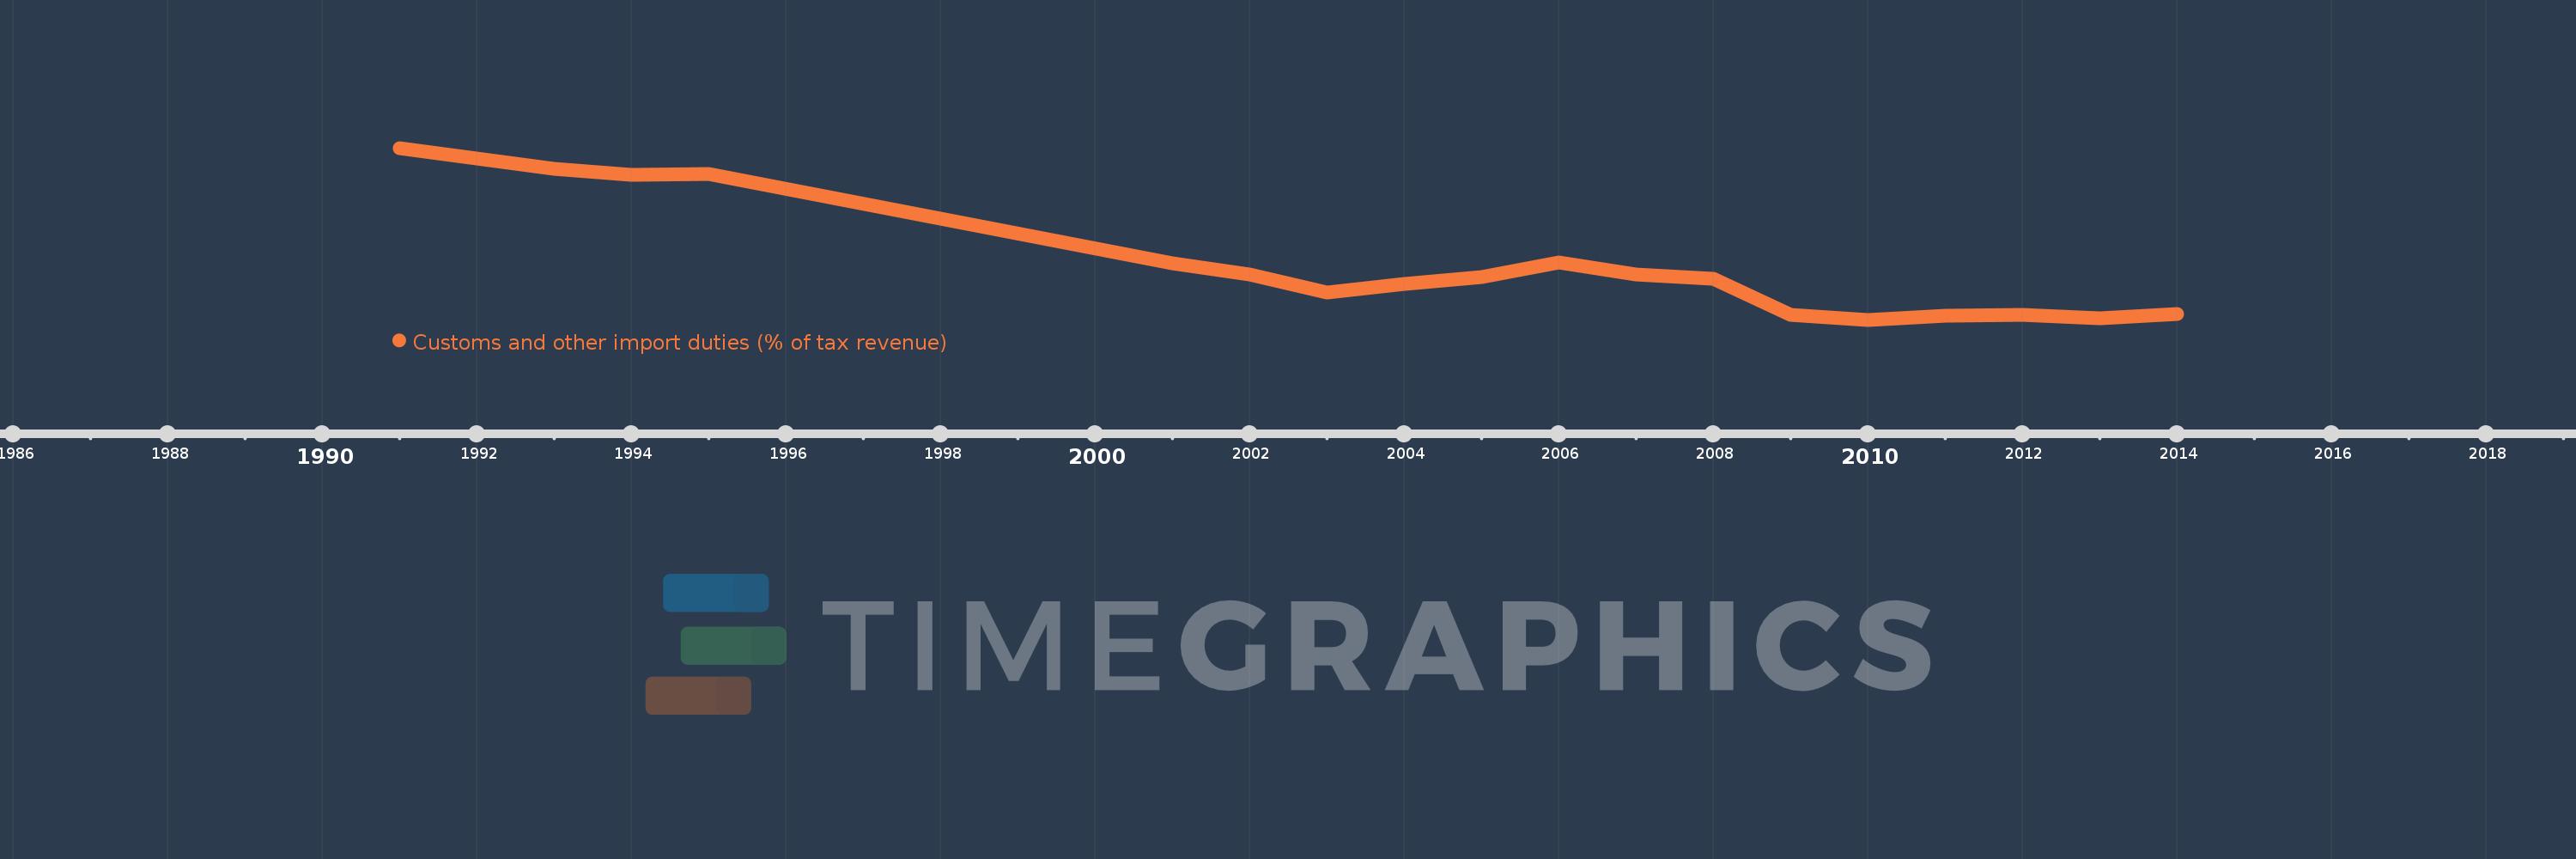
Questa scala temporale mostra un grafico dal 1991 anno al 2014 anno. St. Kitts and Nevis. I dati fino ad 1990 anno non disponibili. Il numero di osservazioni attuali secondo i date: 19.
La fonte (nome):
Indicatori dello sviluppo mondiale
La fonte (organizzazione):
International Monetary Fund, Government Finance Statistics Yearbook and data files.
Categorie:
Public Sector, Trade
sono stati aggiornati
23 apr 2017 anni
Indicatori delle variazioni dei valori per anni
In media:
27.34
Minima:
10.467
1 gen 2010 anni
Massimo:
58.621
1 gen 1991 anni
Alla data di osservazione
Valore
Variazione assoluta
La variazione rispetto al valore precedente
1 gen 1991 anni
58.621
+58.621
0.0%
1 gen 1992 anni
55.613
-3.008
-5.13%
1 gen 1993 anni
52.701
-2.912
-5.24%
1 gen 1994 anni
51.049
-1.653
-3.14%
1 gen 1995 anni
51.243
+0.194
0.38%
1 gen 2001 anni
26.383
-24.86
-48.51%
1 gen 2002 anni
23.124
-3.259
-12.35%
1 gen 2003 anni
18.107
-5.017
-21.7%
1 gen 2004 anni
20.401
+2.294
12.67%
1 gen 2005 anni
22.345
+1.944
9.53%
1 gen 2006 anni
26.501
+4.157
18.6%
1 gen 2007 anni
23.045
-3.457
-13.04%
1 gen 2008 anni
21.958
-1.087
-4.72%
1 gen 2009 anni
11.836
-10.122
-46.1%
1 gen 2010 anni
10.467
-1.369
-11.57%
1 gen 2011 anni
11.507
+1.04
9.94%
1 gen 2012 anni
11.744
+0.236
2.05%
1 gen 2013 anni
10.786
-0.958
-8.16%
1 gen 2014 anni
12.034
+1.249
11.58%
Classificazione dei paesi secondo i statistiche attuali per anni