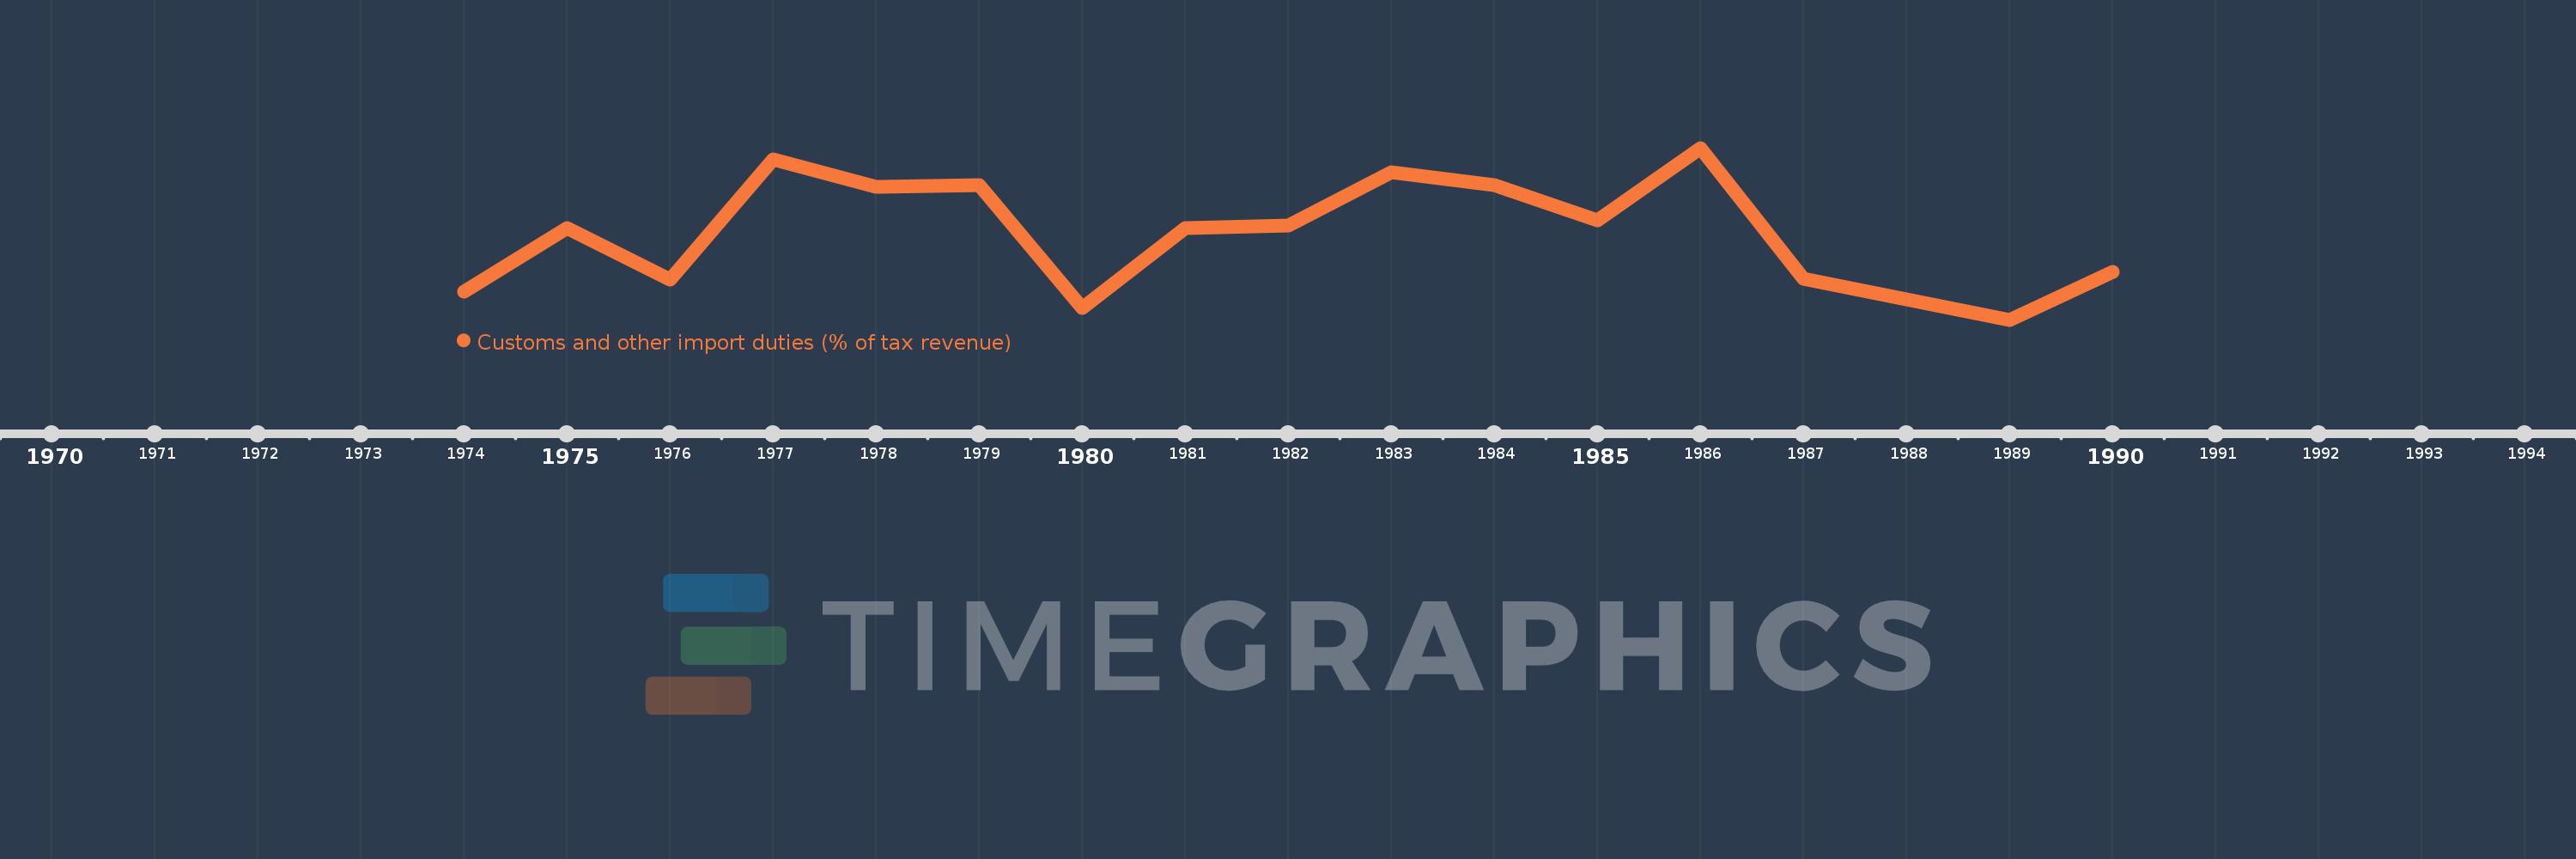
Questa scala temporale mostra un grafico dal 1974 anno al 1990 anno. Bahamas, The. I dati fino ad 1973 anno non disponibili. Il numero di osservazioni attuali secondo i date: 16.
La fonte (nome):
Indicatori dello sviluppo mondiale
La fonte (organizzazione):
International Monetary Fund, Government Finance Statistics Yearbook and data files.
Categorie:
Public Sector, Trade
sono stati aggiornati
23 apr 2017 anni
Indicatori delle variazioni dei valori per anni
In media:
73.102
Minima:
70.194
1 gen 1989 anni
Massimo:
75.793
1 gen 1986 anni
Alla data di osservazione
Valore
Variazione assoluta
La variazione rispetto al valore precedente
1 gen 1974 anni
71.12
+71.12
0.0%
1 gen 1975 anni
73.182
+2.062
2.9%
1 gen 1976 anni
71.502
-1.68
-2.3%
1 gen 1977 anni
75.429
+3.927
5.49%
1 gen 1978 anni
74.515
-0.914
-1.21%
1 gen 1979 anni
74.575
+0.06
0.08%
1 gen 1980 anni
70.575
-4.0
-5.36%
1 gen 1981 anni
73.173
+2.598
3.68%
1 gen 1982 anni
73.26
+0.087
0.12%
1 gen 1983 anni
75.0
+1.74
2.38%
1 gen 1984 anni
74.593
-0.407
-0.54%
1 gen 1985 anni
73.432
-1.162
-1.56%
1 gen 1986 anni
75.793
+2.361
3.22%
1 gen 1987 anni
71.517
-4.276
-5.64%
1 gen 1989 anni
70.194
-1.323
-1.85%
1 gen 1990 anni
71.765
+1.571
2.24%
Classificazione dei paesi secondo i statistiche attuali per anni