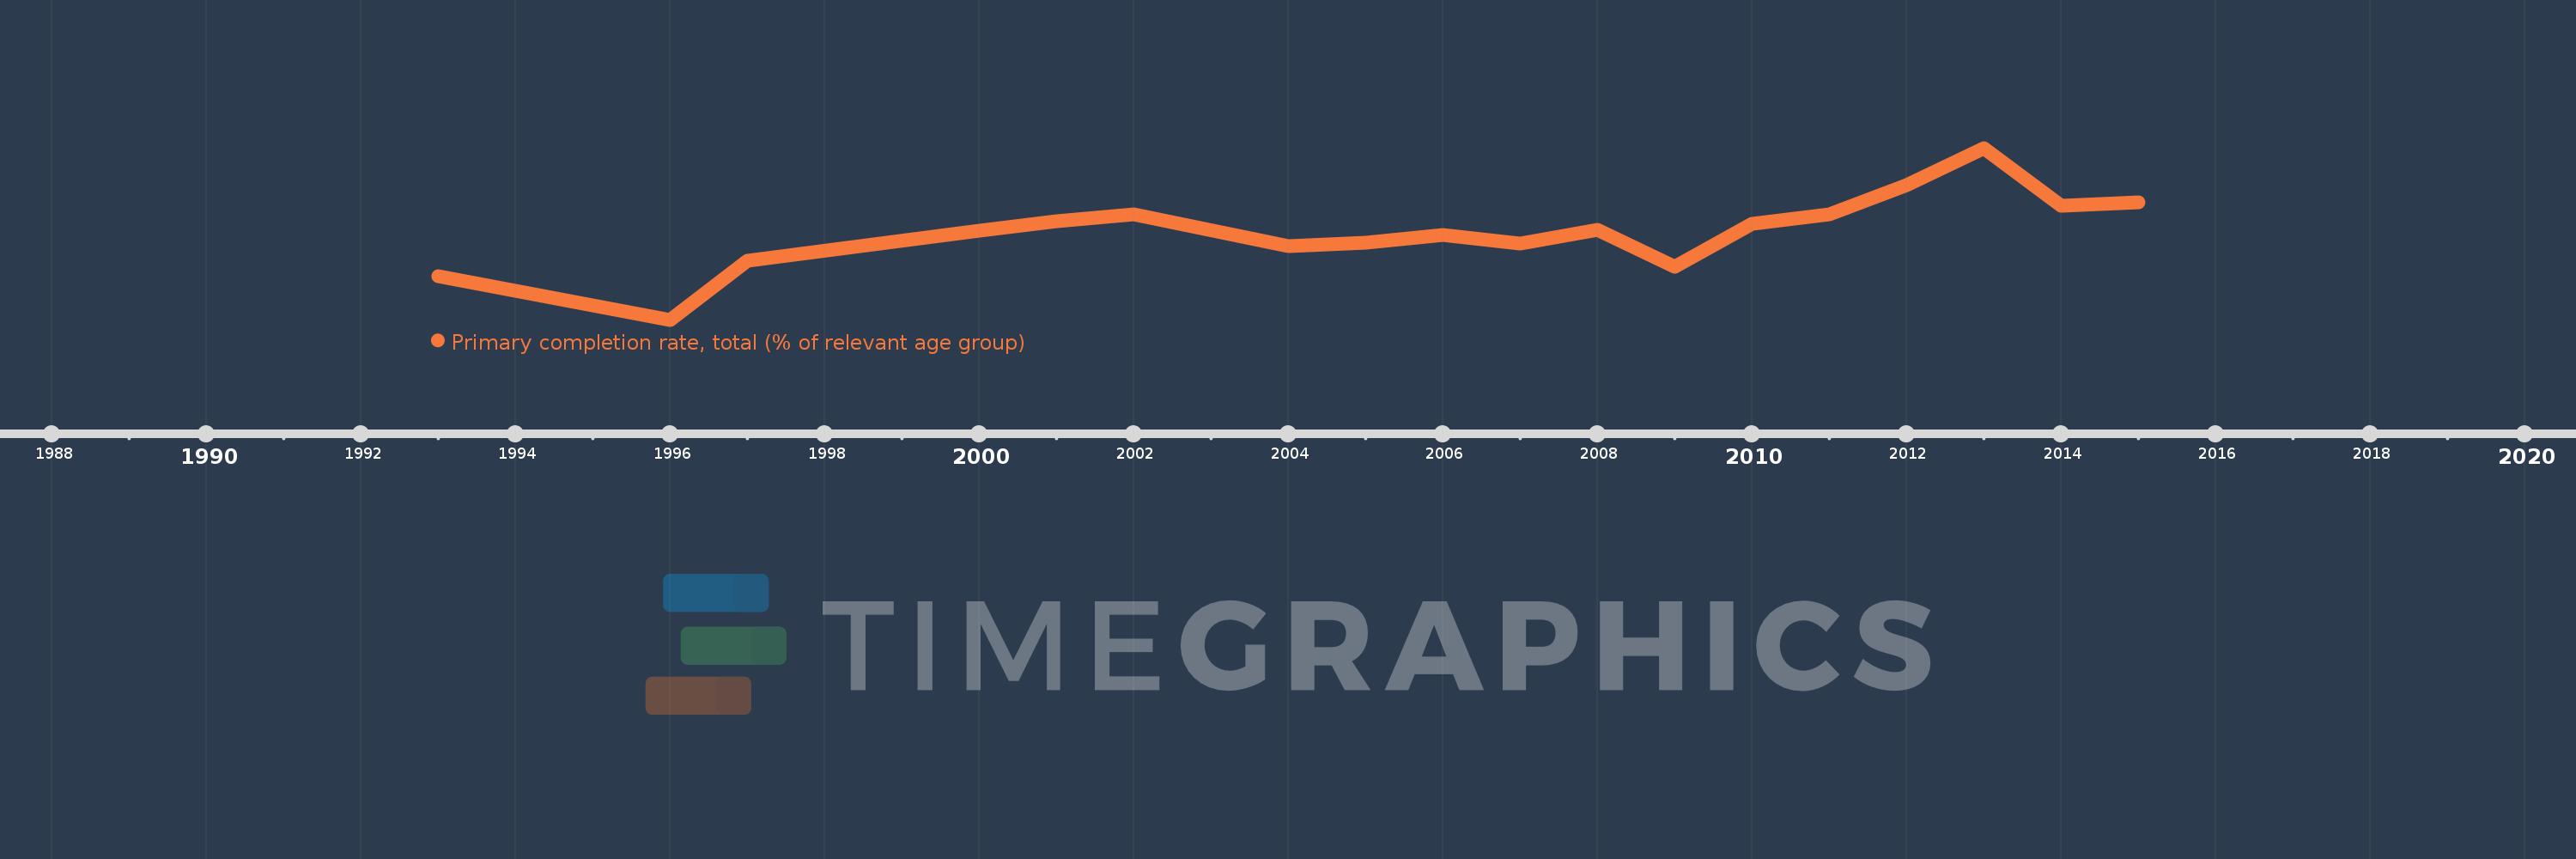
Questa scala temporale mostra un grafico dal 1993 anno al 2015 anno. Belize. I dati fino ad 1992 anno non disponibili. Il numero di osservazioni attuali secondo i date: 18.
La fonte (nome):
Indicatori dello sviluppo mondiale
La fonte (organizzazione):
United Nations Educational, Scientific, and Cultural Organization (UNESCO) Institute for Statistics.
Categorie:
Aid Effectiveness, Climate Change, Education
sono stati aggiornati
23 apr 2017 anni
Indicatori delle variazioni dei valori per anni
In media:
98.889
Minima:
89.164
1 gen 1996 anni
Massimo:
108.085
1 gen 2013 anni
Alla data di osservazione
Valore
Variazione assoluta
La variazione rispetto al valore precedente
1 gen 1993 anni
93.922
+93.922
0.0%
1 gen 1996 anni
89.164
-4.758
-5.07%
1 gen 1997 anni
95.687
+6.523
7.32%
1 gen 2000 anni
98.935
+3.248
3.39%
1 gen 2001 anni
100.033
+1.098
1.11%
1 gen 2002 anni
100.818
+0.785
0.78%
1 gen 2004 anni
97.273
-3.545
-3.52%
1 gen 2005 anni
97.694
+0.421
0.43%
1 gen 2006 anni
98.497
+0.803
0.82%
1 gen 2007 anni
97.522
-0.975
-0.99%
1 gen 2008 anni
99.049
+1.527
1.57%
1 gen 2009 anni
94.969
-4.079
-4.12%
1 gen 2010 anni
99.711
+4.741
4.99%
1 gen 2011 anni
100.781
+1.071
1.07%
1 gen 2012 anni
104.019
+3.238
3.21%
1 gen 2013 anni
108.085
+4.066
3.91%
1 gen 2014 anni
101.712
-6.374
-5.9%
1 gen 2015 anni
102.126
+0.414
0.41%
Classificazione dei paesi secondo i statistiche attuali per anni