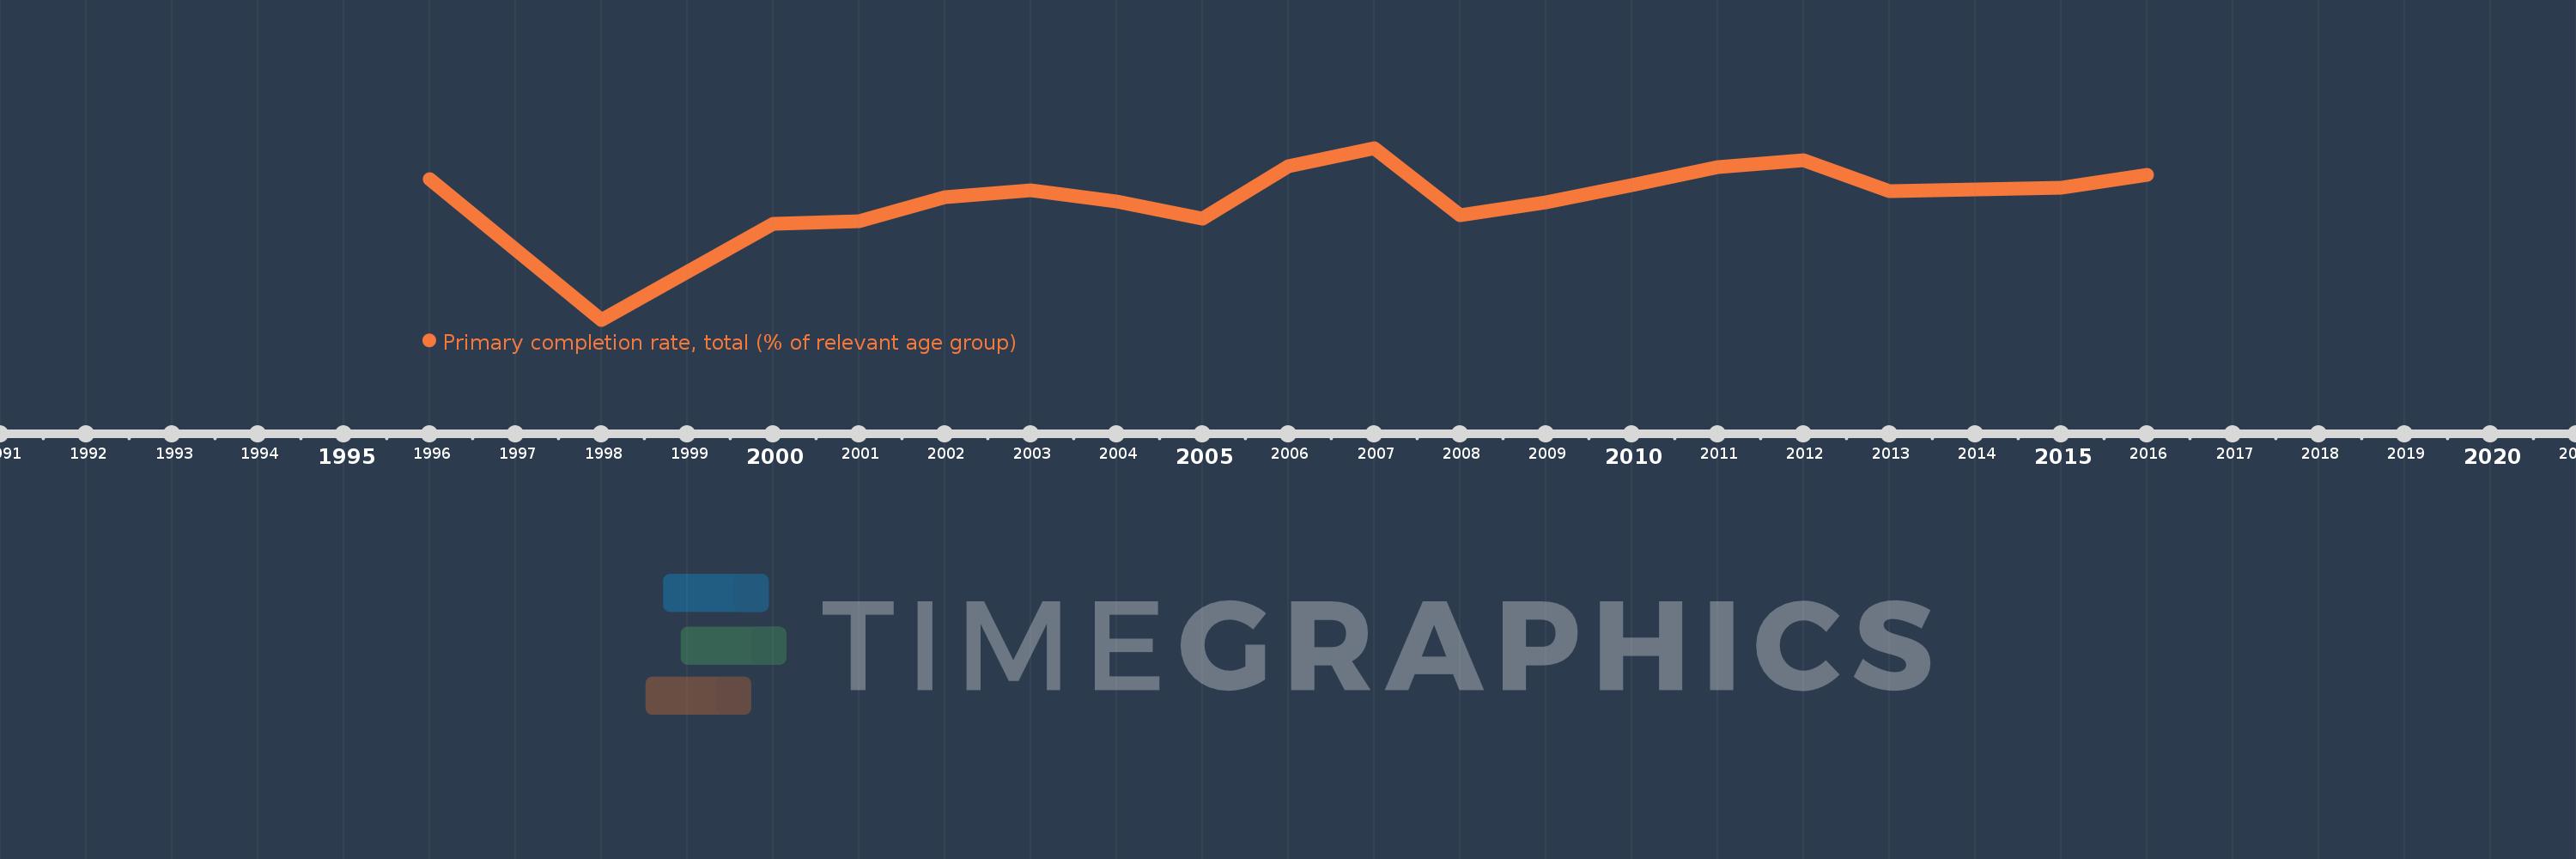
Questa scala temporale mostra un grafico dal 1996 anno al 2016 anno. Tajikistan. I dati fino ad 1995 anno non disponibili. Il numero di osservazioni attuali secondo i date: 18.
La fonte (nome):
Indicatori dello sviluppo mondiale
La fonte (organizzazione):
United Nations Educational, Scientific, and Cultural Organization (UNESCO) Institute for Statistics.
Categorie:
Aid Effectiveness, Climate Change, Education
sono stati aggiornati
23 apr 2017 anni
Indicatori delle variazioni dei valori per anni
In media:
95.586
Minima:
73.831
1 gen 1998 anni
Massimo:
104.317
1 gen 2007 anni
Alla data di osservazione
Valore
Variazione assoluta
La variazione rispetto al valore precedente
1 gen 1996 anni
98.851
+98.851
0.0%
1 gen 1998 anni
73.831
-25.02
-25.31%
1 gen 2000 anni
90.792
+16.962
22.97%
1 gen 2001 anni
91.338
+0.546
0.6%
1 gen 2002 anni
95.644
+4.305
4.71%
1 gen 2003 anni
96.757
+1.114
1.16%
1 gen 2004 anni
94.889
-1.869
-1.93%
1 gen 2005 anni
91.706
-3.183
-3.35%
1 gen 2006 anni
101.053
+9.347
10.19%
1 gen 2007 anni
104.317
+3.263
3.23%
1 gen 2008 anni
92.453
-11.864
-11.37%
1 gen 2009 anni
94.651
+2.198
2.38%
1 gen 2010 anni
97.779
+3.128
3.31%
1 gen 2011 anni
100.938
+3.158
3.23%
1 gen 2012 anni
102.1
+1.162
1.15%
1 gen 2013 anni
96.696
-5.405
-5.29%
1 gen 2015 anni
97.19
+0.495
0.51%
1 gen 2016 anni
99.558
+2.368
2.44%
Classificazione dei paesi secondo i statistiche attuali per anni