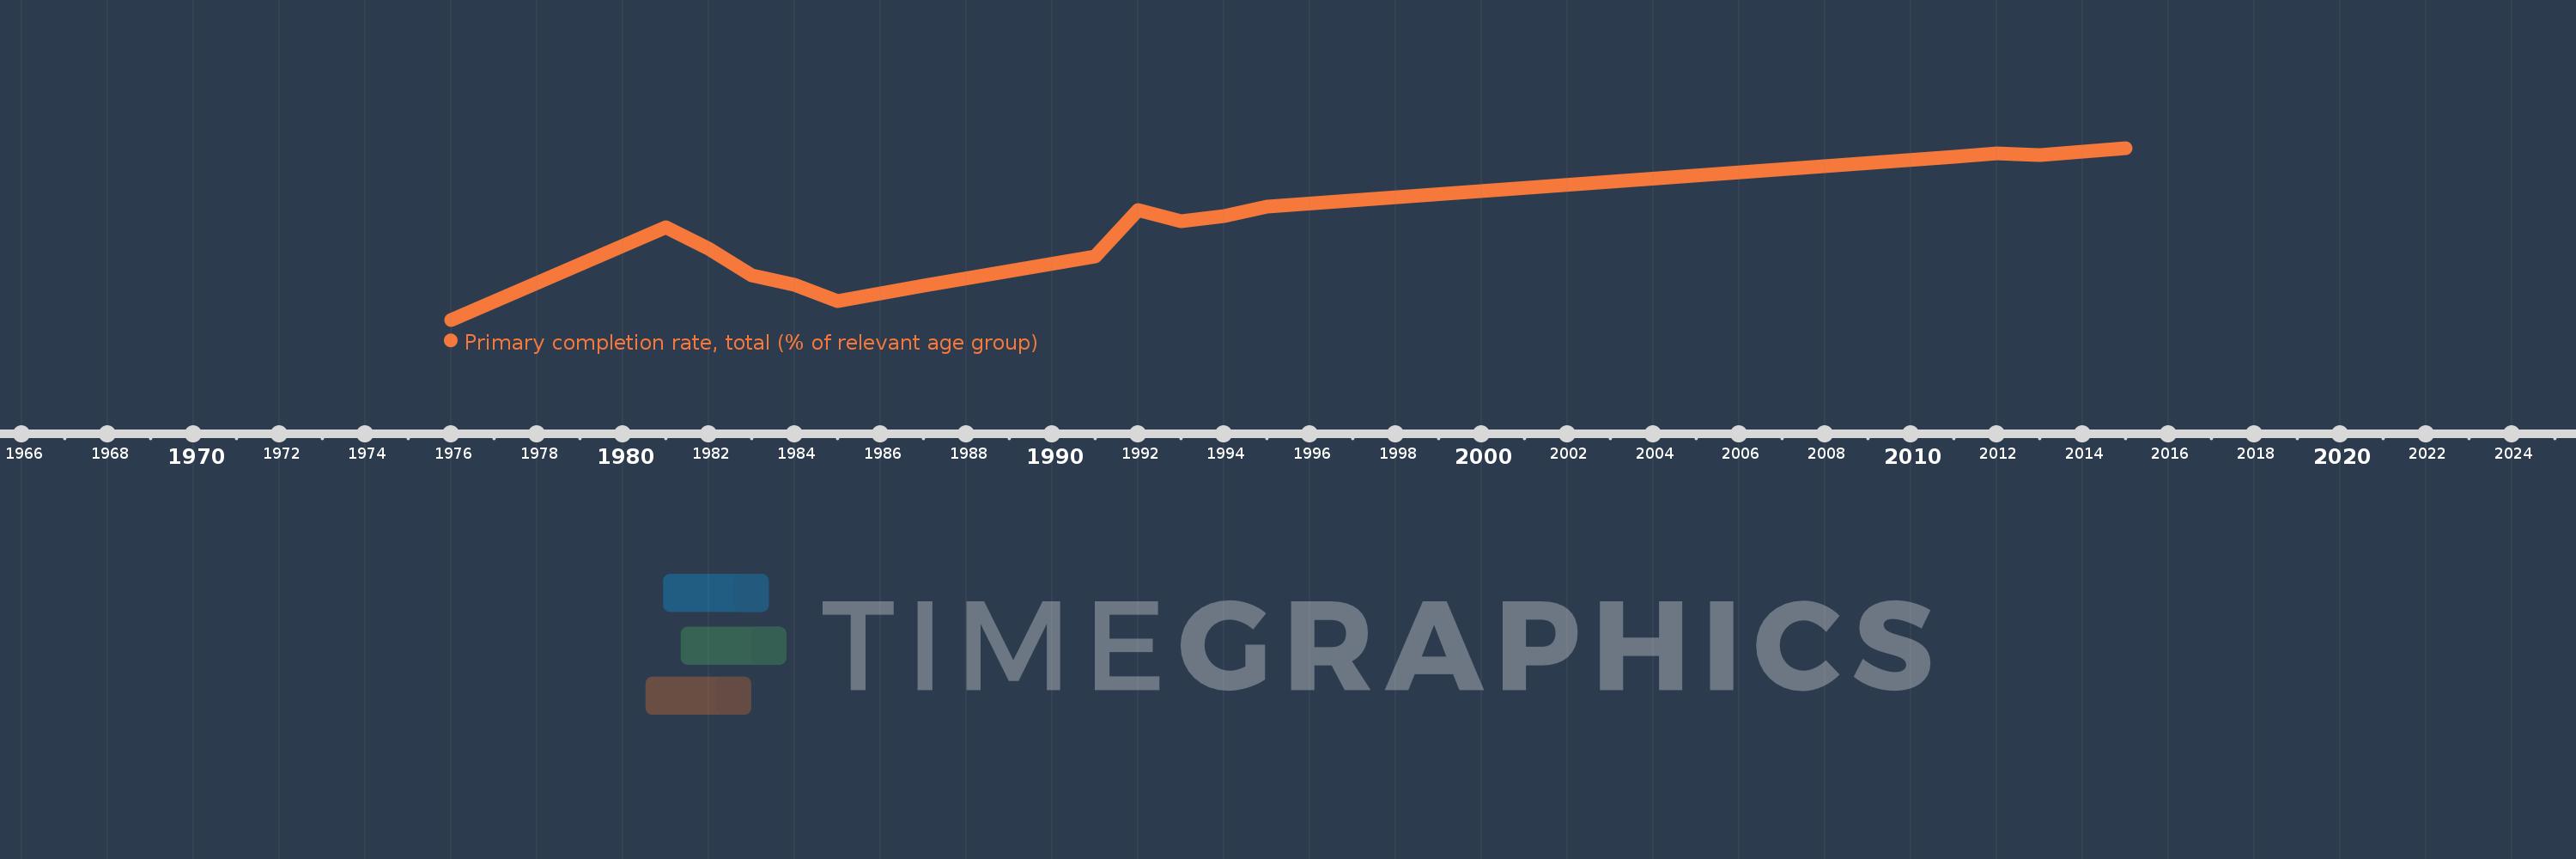
Questa scala temporale mostra un grafico dal 1976 anno al 2015 anno. Solomon Islands. I dati fino ad 1975 anno non disponibili. Il numero di osservazioni attuali secondo i date: 17.
La fonte (nome):
Indicatori dello sviluppo mondiale
La fonte (organizzazione):
United Nations Educational, Scientific, and Cultural Organization (UNESCO) Institute for Statistics.
Categorie:
Aid Effectiveness, Climate Change, Education
sono stati aggiornati
23 apr 2017 anni
Indicatori delle variazioni dei valori per anni
In media:
68.014
Minima:
44.098
1 gen 1976 anni
Massimo:
87.272
1 gen 2015 anni
Alla data di osservazione
Valore
Variazione assoluta
La variazione rispetto al valore precedente
1 gen 1976 anni
44.098
+44.098
0.0%
1 gen 1981 anni
67.394
+23.297
52.83%
1 gen 1982 anni
62.002
-5.392
-8.0%
1 gen 1983 anni
55.353
-6.65
-10.72%
1 gen 1984 anni
52.853
-2.499
-4.52%
1 gen 1985 anni
48.848
-4.005
-7.58%
1 gen 1987 anni
52.65
+3.802
7.78%
1 gen 1991 anni
60.081
+7.431
14.11%
1 gen 1992 anni
71.641
+11.56
19.24%
1 gen 1993 anni
68.84
-2.8
-3.91%
1 gen 1994 anni
70.12
+1.279
1.86%
1 gen 1995 anni
72.473
+2.354
3.36%
1 gen 2011 anni
85.138
+12.665
17.48%
1 gen 2012 anni
85.83
+0.691
0.81%
1 gen 2013 anni
85.387
-0.443
-0.52%
1 gen 2014 anni
86.257
+0.87
1.02%
1 gen 2015 anni
87.272
+1.015
1.18%
Classificazione dei paesi secondo i statistiche attuali per anni