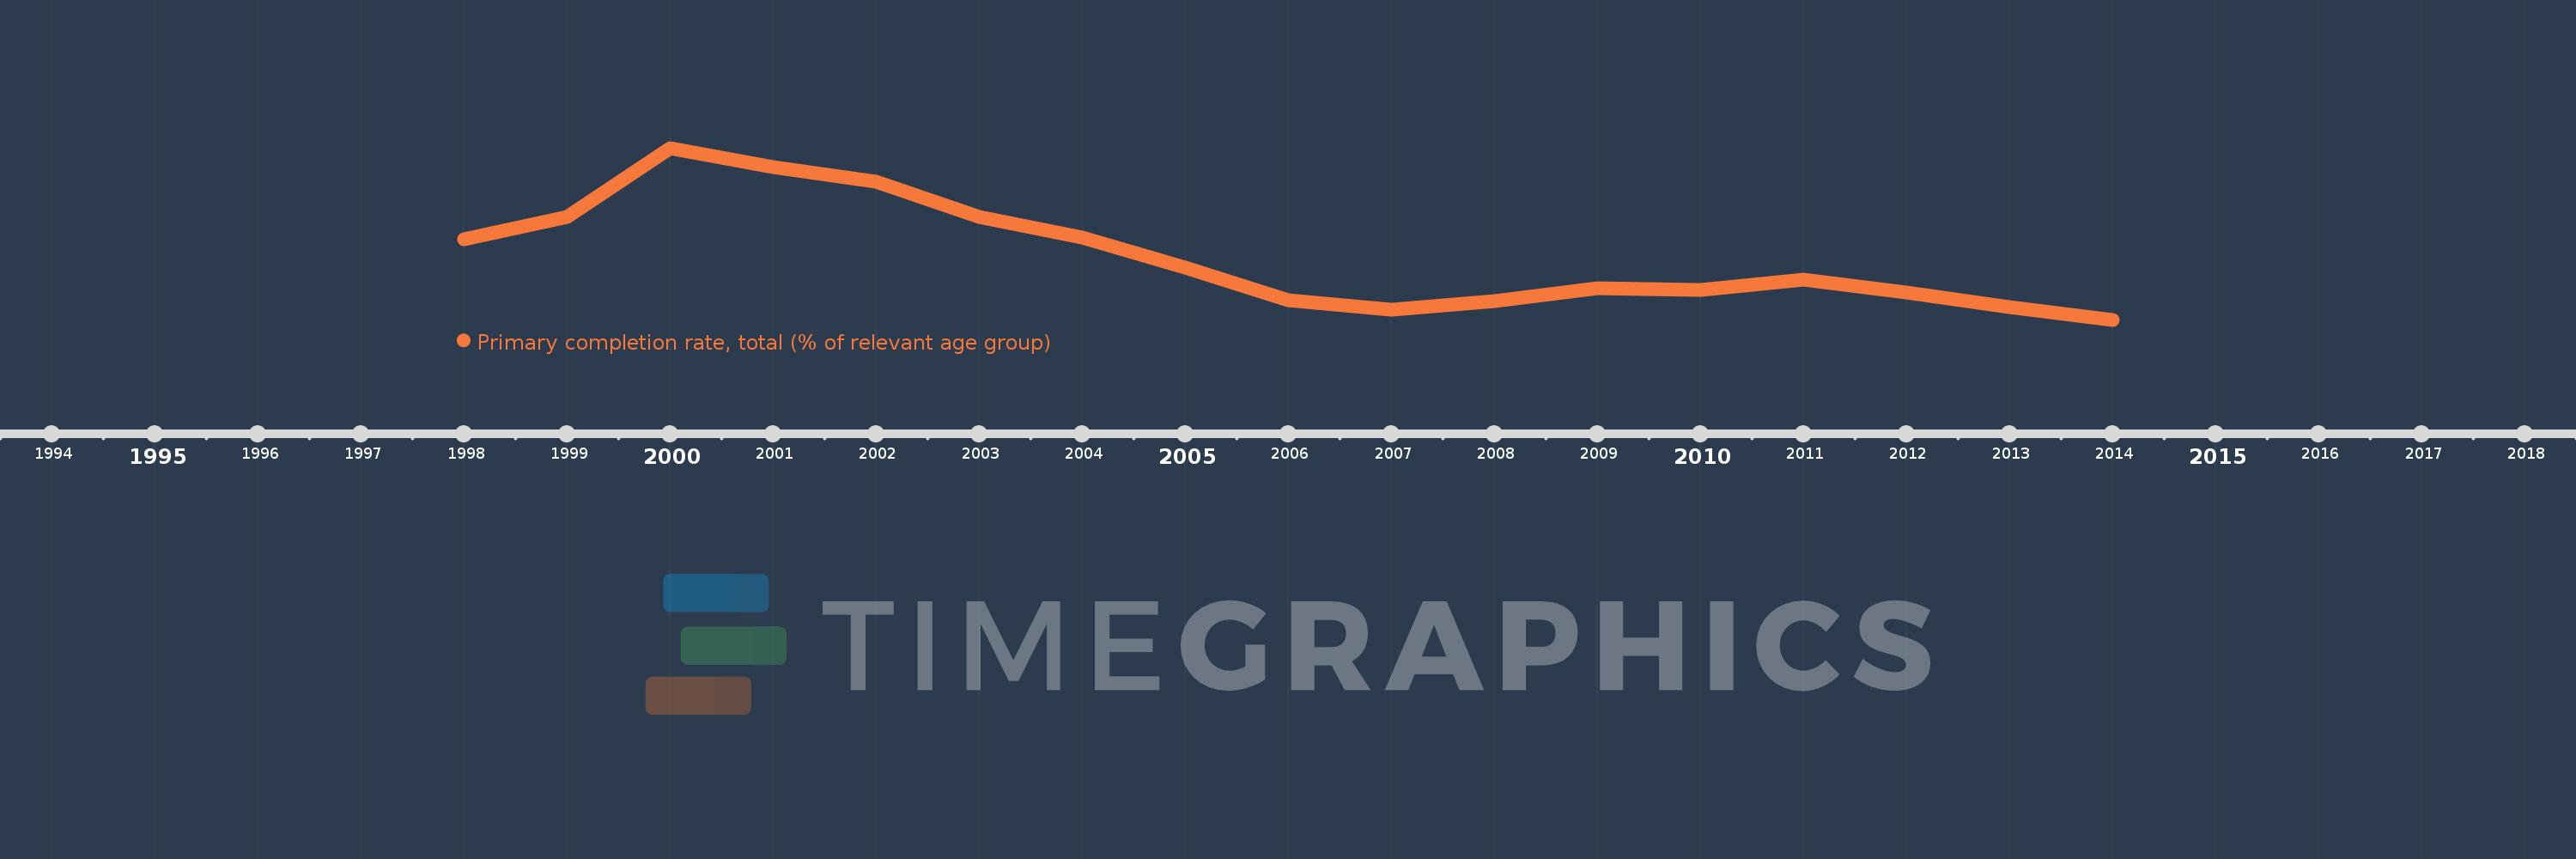
Questa scala temporale mostra un grafico dal 1998 anno al 2014 anno. Lebanon. I dati fino ad 1997 anno non disponibili. Il numero di osservazioni attuali secondo i date: 17.
La fonte (nome):
Indicatori dello sviluppo mondiale
La fonte (organizzazione):
United Nations Educational, Scientific, and Cultural Organization (UNESCO) Institute for Statistics.
Categorie:
Aid Effectiveness, Climate Change, Education
sono stati aggiornati
23 apr 2017 anni
Indicatori delle variazioni dei valori per anni
In media:
93.528
Minima:
78.109
1 gen 2014 anni
Massimo:
120.14
1 gen 2000 anni
Alla data di osservazione
Valore
Variazione assoluta
La variazione rispetto al valore precedente
1 gen 1998 anni
97.85
+97.85
0.0%
1 gen 1999 anni
103.316
+5.466
5.59%
1 gen 2000 anni
120.14
+16.824
16.28%
1 gen 2001 anni
115.409
-4.731
-3.94%
1 gen 2002 anni
111.831
-3.578
-3.1%
1 gen 2003 anni
103.325
-8.505
-7.61%
1 gen 2004 anni
98.161
-5.164
-5.0%
1 gen 2005 anni
90.894
-7.267
-7.4%
1 gen 2006 anni
82.922
-7.972
-8.77%
1 gen 2007 anni
80.476
-2.446
-2.95%
1 gen 2008 anni
82.592
+2.116
2.63%
1 gen 2009 anni
85.777
+3.186
3.86%
1 gen 2010 anni
85.402
-0.375
-0.44%
1 gen 2011 anni
87.886
+2.484
2.91%
1 gen 2012 anni
84.751
-3.135
-3.57%
1 gen 2013 anni
81.13
-3.621
-4.27%
1 gen 2014 anni
78.109
-3.02
-3.72%
Classificazione dei paesi secondo i statistiche attuali per anni