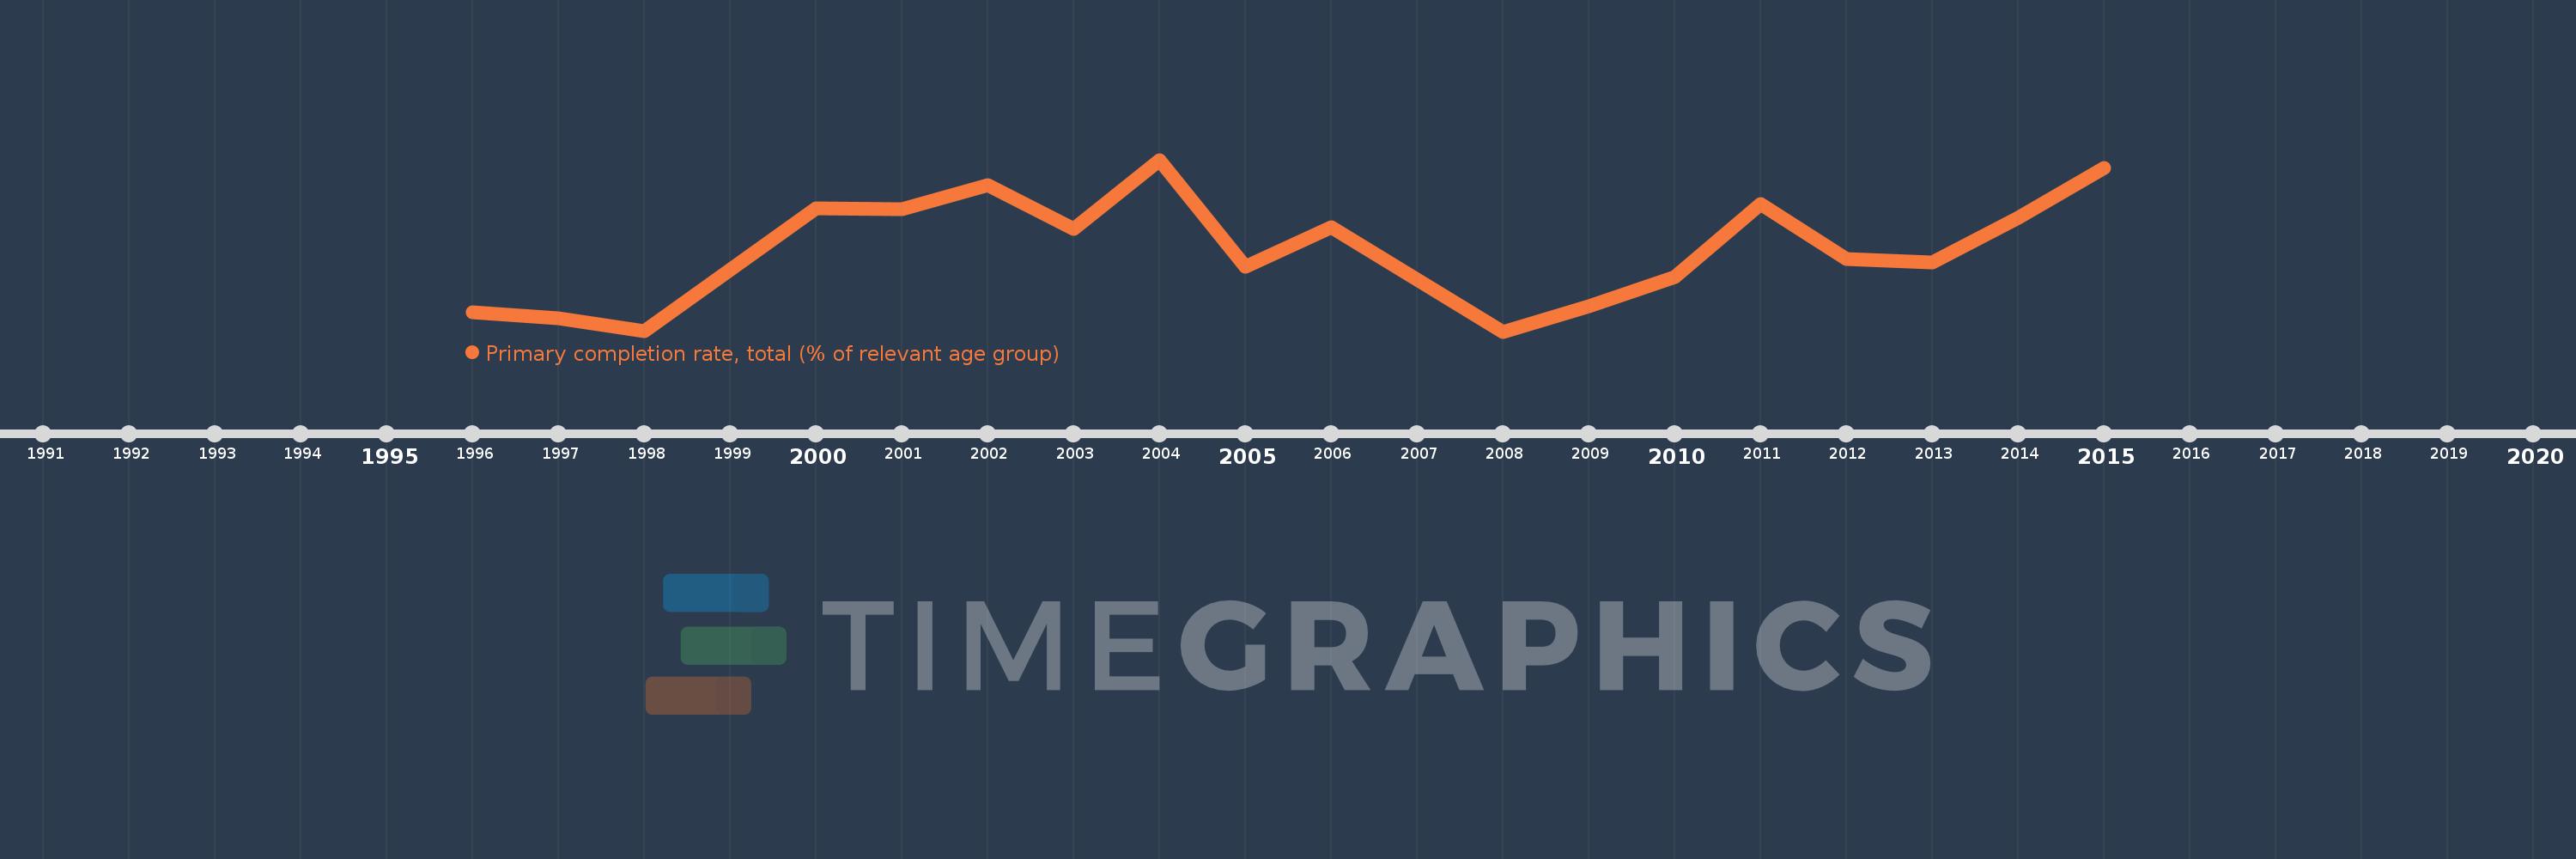
Questa scala temporale mostra un grafico dal 1996 anno al 2015 anno. West Bank and Gaza. I dati fino ad 1995 anno non disponibili. Il numero di osservazioni attuali secondo i date: 18.
La fonte (nome):
Indicatori dello sviluppo mondiale
La fonte (organizzazione):
United Nations Educational, Scientific, and Cultural Organization (UNESCO) Institute for Statistics.
Categorie:
Aid Effectiveness, Climate Change, Education
sono stati aggiornati
23 apr 2017 anni
Indicatori delle variazioni dei valori per anni
In media:
91.583
Minima:
86.149
1 gen 2008 anni
Massimo:
97.382
1 gen 2004 anni
Alla data di osservazione
Valore
Variazione assoluta
La variazione rispetto al valore precedente
1 gen 1996 anni
87.438
+87.438
0.0%
1 gen 1997 anni
87.008
-0.43
-0.49%
1 gen 1998 anni
86.191
-0.817
-0.94%
1 gen 2000 anni
94.223
+8.032
9.32%
1 gen 2001 anni
94.138
-0.085
-0.09%
1 gen 2002 anni
95.707
+1.569
1.67%
1 gen 2003 anni
92.846
-2.861
-2.99%
1 gen 2004 anni
97.382
+4.536
4.89%
1 gen 2005 anni
90.415
-6.967
-7.15%
1 gen 2006 anni
92.975
+2.56
2.83%
1 gen 2008 anni
86.149
-6.826
-7.34%
1 gen 2009 anni
87.779
+1.63
1.89%
1 gen 2010 anni
89.688
+1.909
2.17%
1 gen 2011 anni
94.511
+4.823
5.38%
1 gen 2012 anni
90.895
-3.616
-3.83%
1 gen 2013 anni
90.674
-0.221
-0.24%
1 gen 2014 anni
93.607
+2.932
3.23%
1 gen 2015 anni
96.874
+3.267
3.49%
Classificazione dei paesi secondo i statistiche attuali per anni