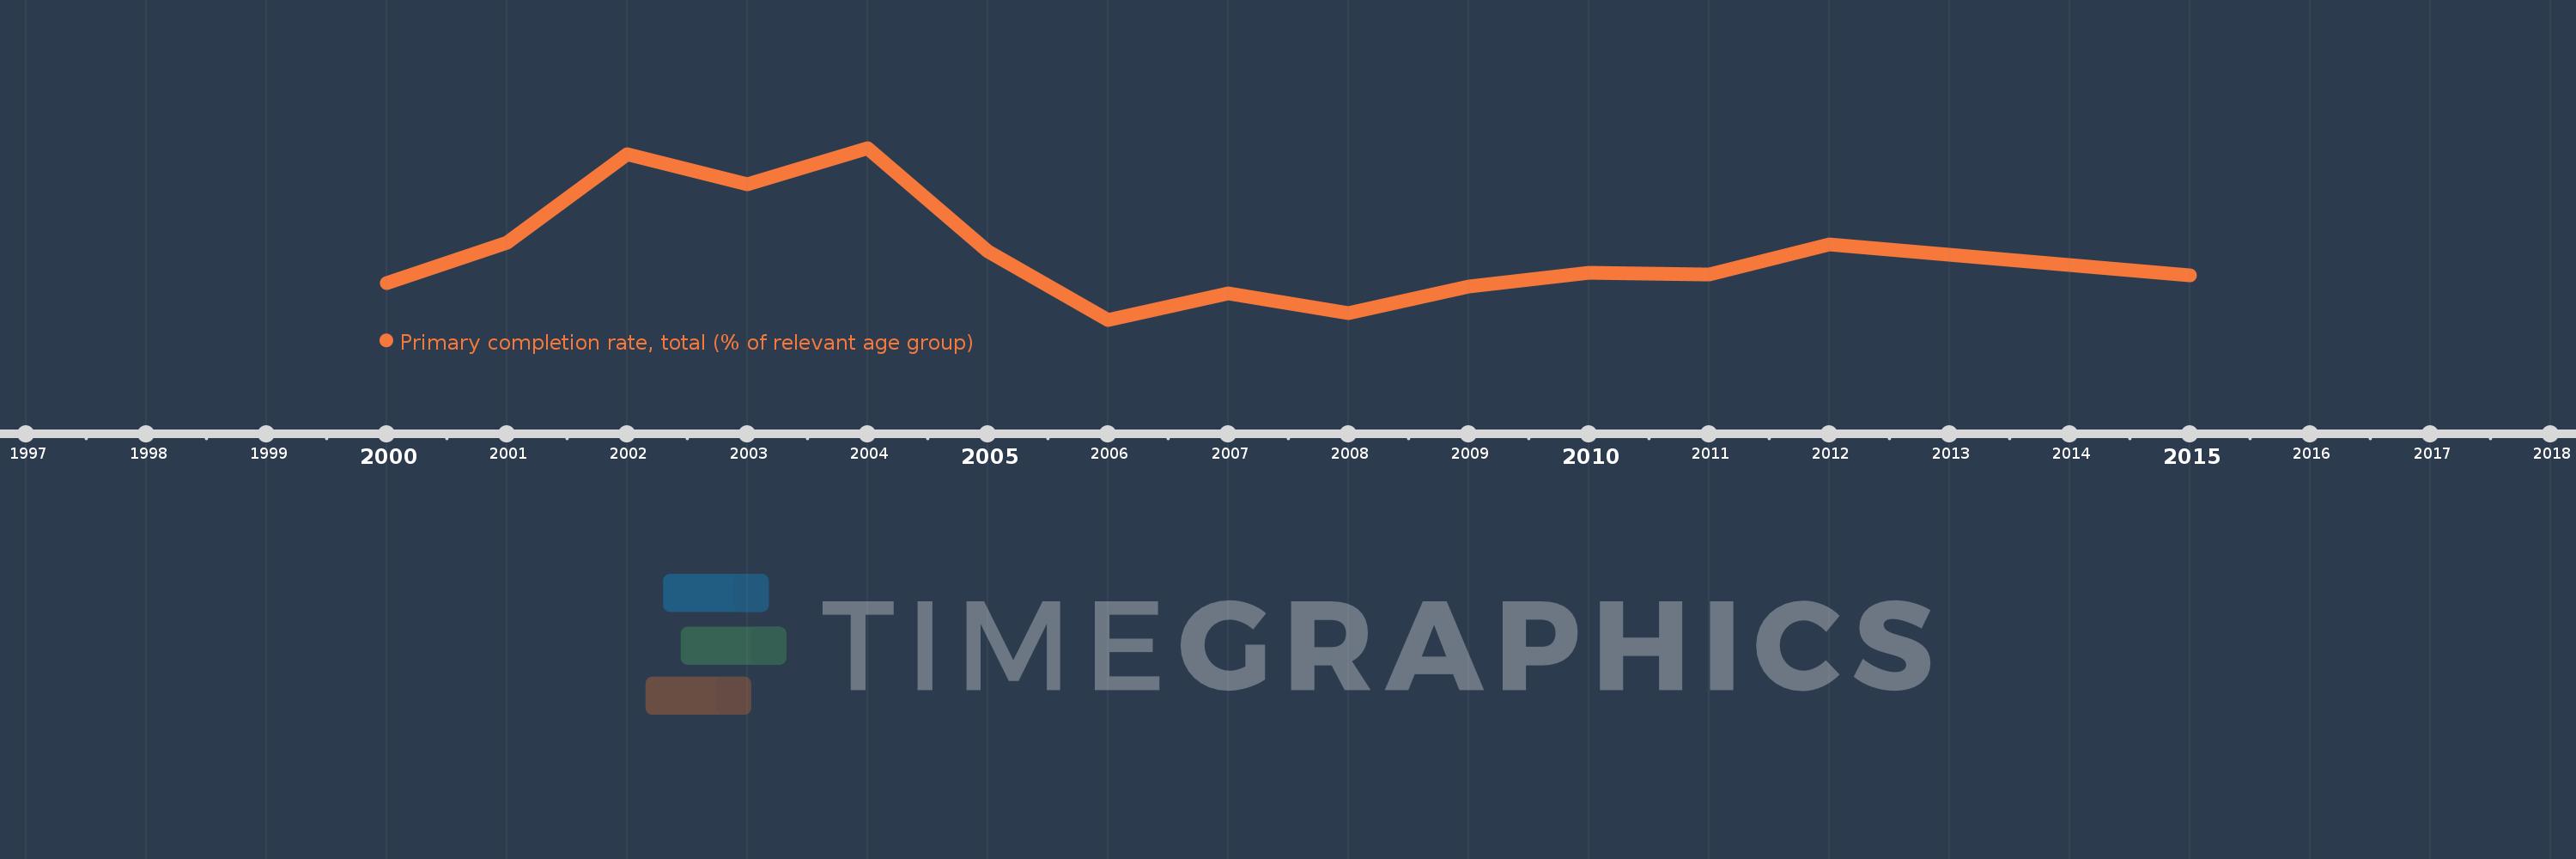
Questa scala temporale mostra un grafico dal 2000 anno al 2015 anno. Barbados. I dati fino ad 1999 anno non disponibili. Il numero di osservazioni attuali secondo i date: 14.
La fonte (nome):
Indicatori dello sviluppo mondiale
La fonte (organizzazione):
United Nations Educational, Scientific, and Cultural Organization (UNESCO) Institute for Statistics.
Categorie:
Aid Effectiveness, Climate Change, Education
sono stati aggiornati
23 apr 2017 anni
Indicatori delle variazioni dei valori per anni
In media:
97.485
Minima:
91.671
1 gen 2006 anni
Massimo:
106.637
1 gen 2004 anni
Alla data di osservazione
Valore
Variazione assoluta
La variazione rispetto al valore precedente
1 gen 2000 anni
94.901
+94.901
0.0%
1 gen 2001 anni
98.391
+3.49
3.68%
1 gen 2002 anni
106.101
+7.71
7.84%
1 gen 2003 anni
103.504
-2.597
-2.45%
1 gen 2004 anni
106.637
+3.133
3.03%
1 gen 2005 anni
97.661
-8.976
-8.42%
1 gen 2006 anni
91.671
-5.99
-6.13%
1 gen 2007 anni
93.939
+2.268
2.47%
1 gen 2008 anni
92.276
-1.663
-1.77%
1 gen 2009 anni
94.575
+2.3
2.49%
1 gen 2010 anni
95.747
+1.172
1.24%
1 gen 2011 anni
95.617
-0.131
-0.14%
1 gen 2012 anni
98.219
+2.602
2.72%
1 gen 2015 anni
95.548
-2.671
-2.72%
Classificazione dei paesi secondo i statistiche attuali per anni