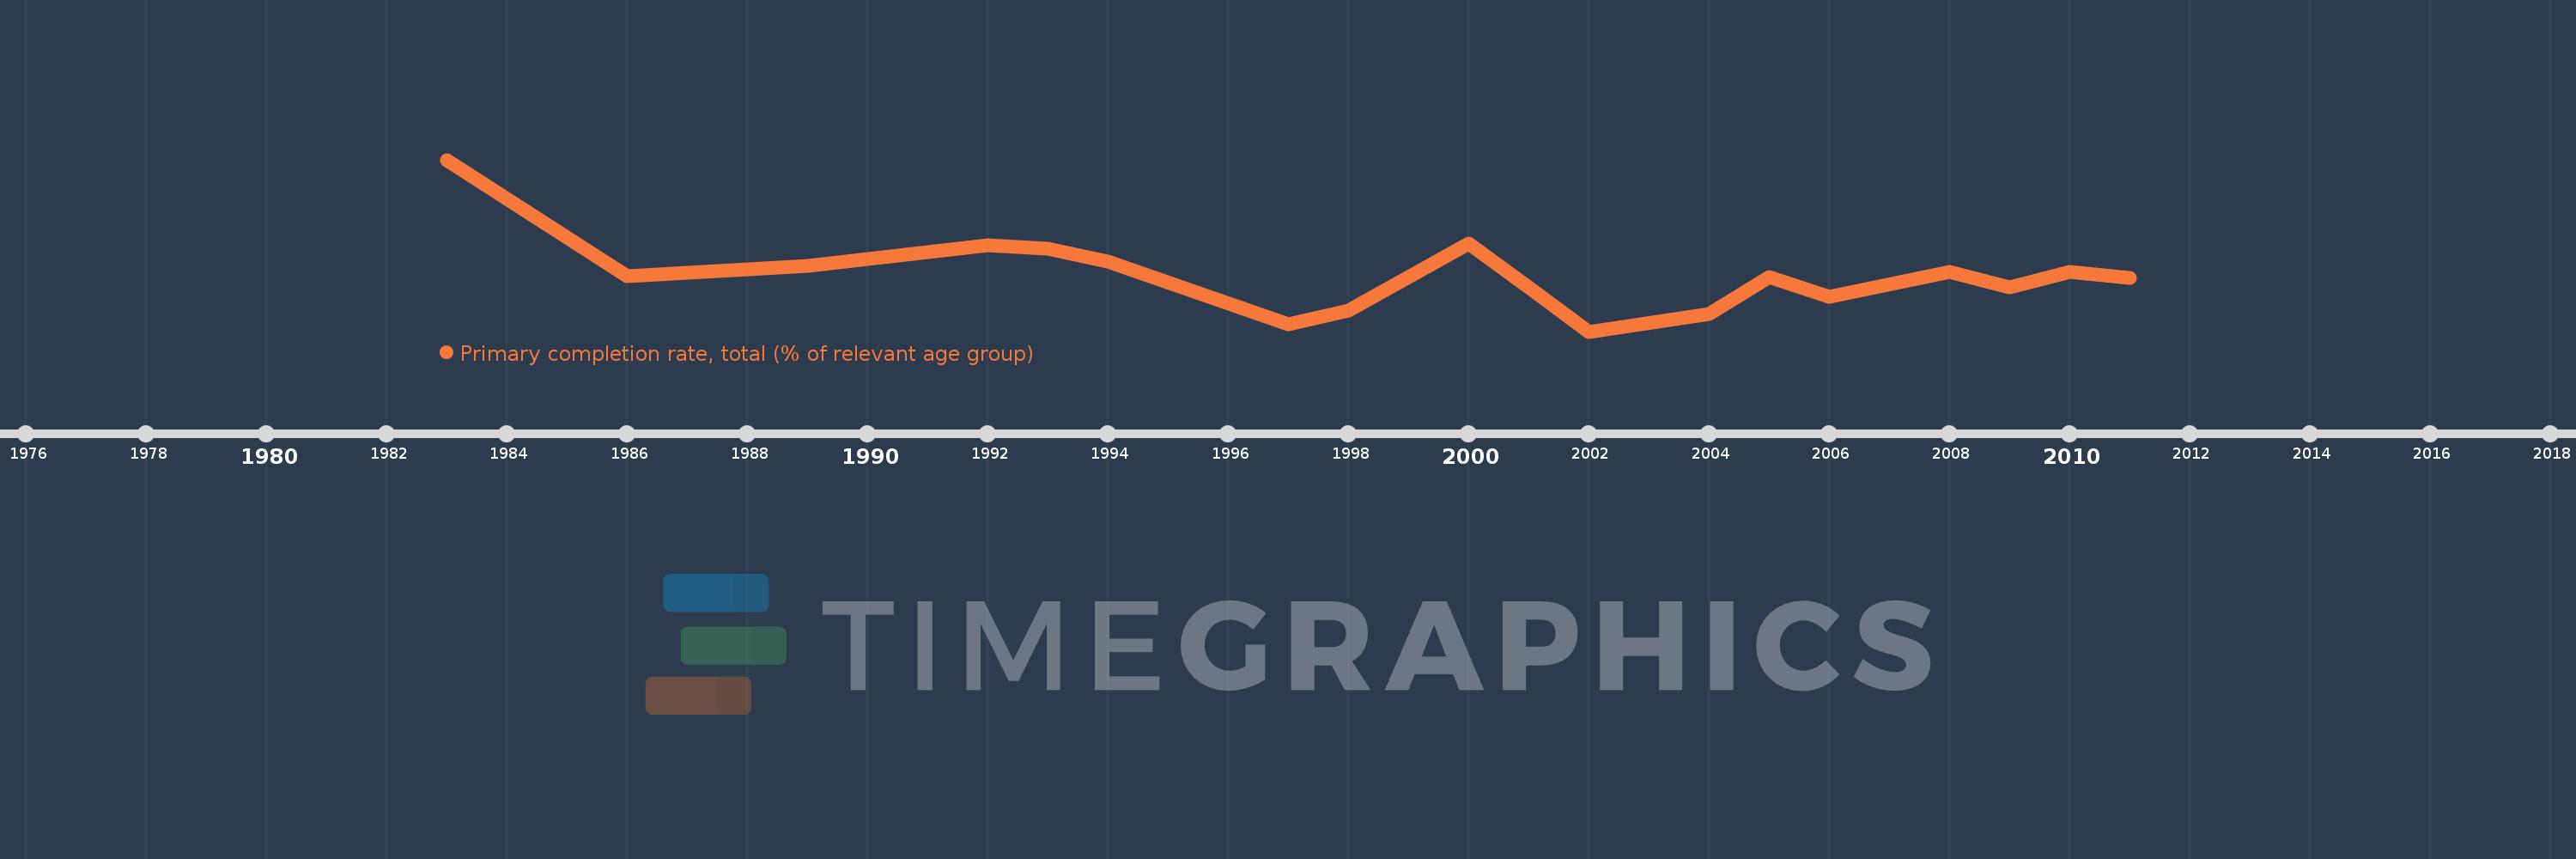
Questa scala temporale mostra un grafico dal 1983 anno al 2011 anno. Trinidad and Tobago. I dati fino ad 1982 anno non disponibili. Il numero di osservazioni attuali secondo i date: 18.
La fonte (nome):
Indicatori dello sviluppo mondiale
La fonte (organizzazione):
United Nations Educational, Scientific, and Cultural Organization (UNESCO) Institute for Statistics.
Categorie:
Aid Effectiveness, Climate Change, Education
sono stati aggiornati
23 apr 2017 anni
Indicatori delle variazioni dei valori per anni
In media:
95.257
Minima:
86.675
1 gen 2002 anni
Massimo:
112.802
1 gen 1983 anni
Alla data di osservazione
Valore
Variazione assoluta
La variazione rispetto al valore precedente
1 gen 1983 anni
112.802
+112.802
0.0%
1 gen 1986 anni
95.087
-17.716
-15.71%
1 gen 1989 anni
96.638
+1.551
1.63%
1 gen 1992 anni
99.789
+3.151
3.26%
1 gen 1993 anni
99.217
-0.572
-0.57%
1 gen 1994 anni
97.293
-1.924
-1.94%
1 gen 1997 anni
87.813
-9.48
-9.74%
1 gen 1998 anni
89.819
+2.007
2.29%
1 gen 2000 anni
100.114
+10.295
11.46%
1 gen 2001 anni
93.347
-6.767
-6.76%
1 gen 2002 anni
86.675
-6.672
-7.15%
1 gen 2004 anni
89.324
+2.649
3.06%
1 gen 2005 anni
95.029
+5.705
6.39%
1 gen 2006 anni
91.926
-3.103
-3.27%
1 gen 2008 anni
95.742
+3.816
4.15%
1 gen 2009 anni
93.412
-2.331
-2.43%
1 gen 2010 anni
95.711
+2.3
2.46%
1 gen 2011 anni
94.887
-0.824
-0.86%
Classificazione dei paesi secondo i statistiche attuali per anni