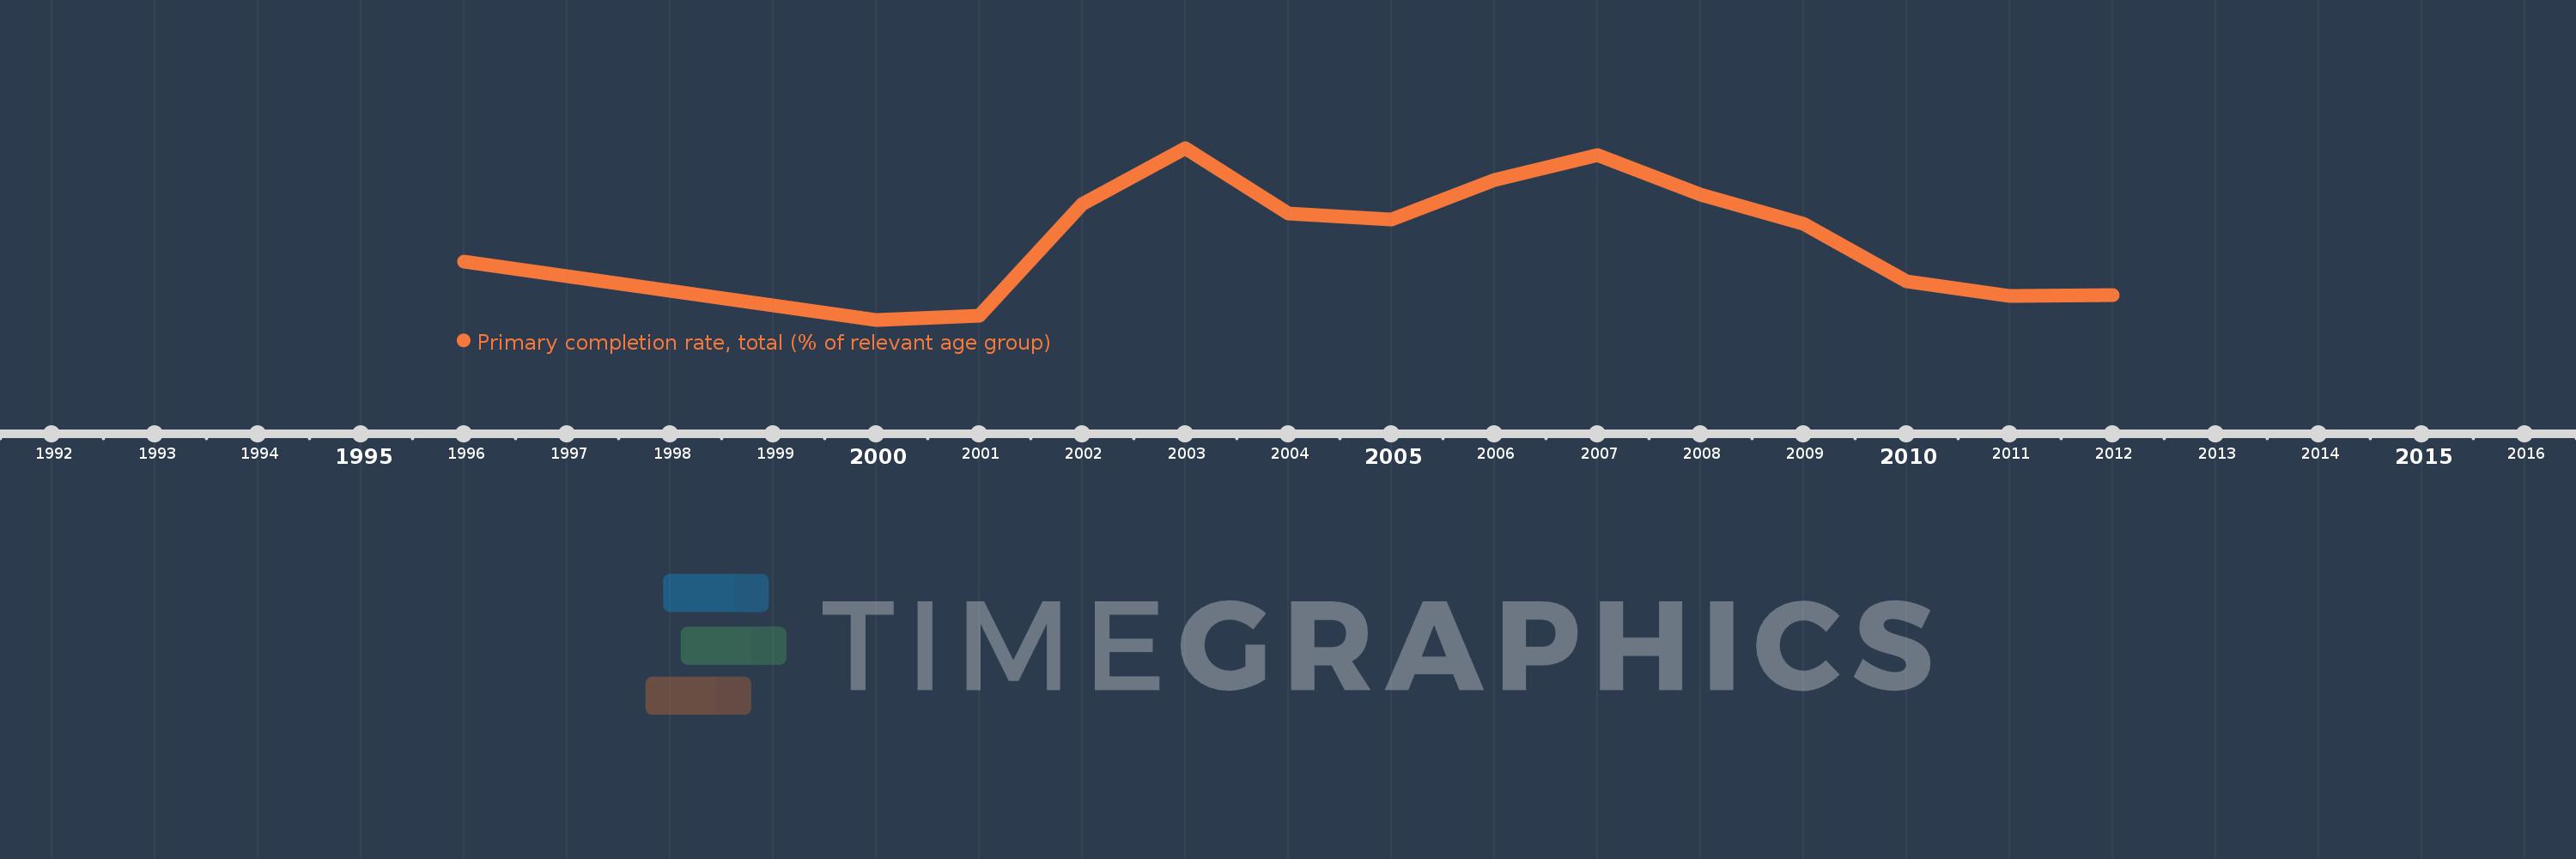
Questa scala temporale mostra un grafico dal 1996 anno al 2012 anno. Uzbekistan. I dati fino ad 1995 anno non disponibili. Il numero di osservazioni attuali secondo i date: 14.
La fonte (nome):
Indicatori dello sviluppo mondiale
La fonte (organizzazione):
United Nations Educational, Scientific, and Cultural Organization (UNESCO) Institute for Statistics.
Categorie:
Aid Effectiveness, Climate Change, Education
sono stati aggiornati
23 apr 2017 anni
Indicatori delle variazioni dei valori per anni
In media:
99.281
Minima:
94.132
1 gen 2000 anni
Massimo:
104.729
1 gen 2003 anni
Alla data di osservazione
Valore
Variazione assoluta
La variazione rispetto al valore precedente
1 gen 1996 anni
97.695
+97.695
0.0%
1 gen 2000 anni
94.132
-3.563
-3.65%
1 gen 2001 anni
94.407
+0.275
0.29%
1 gen 2002 anni
101.267
+6.86
7.27%
1 gen 2003 anni
104.729
+3.463
3.42%
1 gen 2004 anni
100.699
-4.03
-3.85%
1 gen 2005 anni
100.294
-0.405
-0.4%
1 gen 2006 anni
102.74
+2.446
2.44%
1 gen 2007 anni
104.291
+1.551
1.51%
1 gen 2008 anni
101.876
-2.415
-2.32%
1 gen 2009 anni
100.06
-1.817
-1.78%
1 gen 2010 anni
96.48
-3.58
-3.58%
1 gen 2011 anni
95.582
-0.898
-0.93%
1 gen 2012 anni
95.678
+0.095
0.1%
Classificazione dei paesi secondo i statistiche attuali per anni