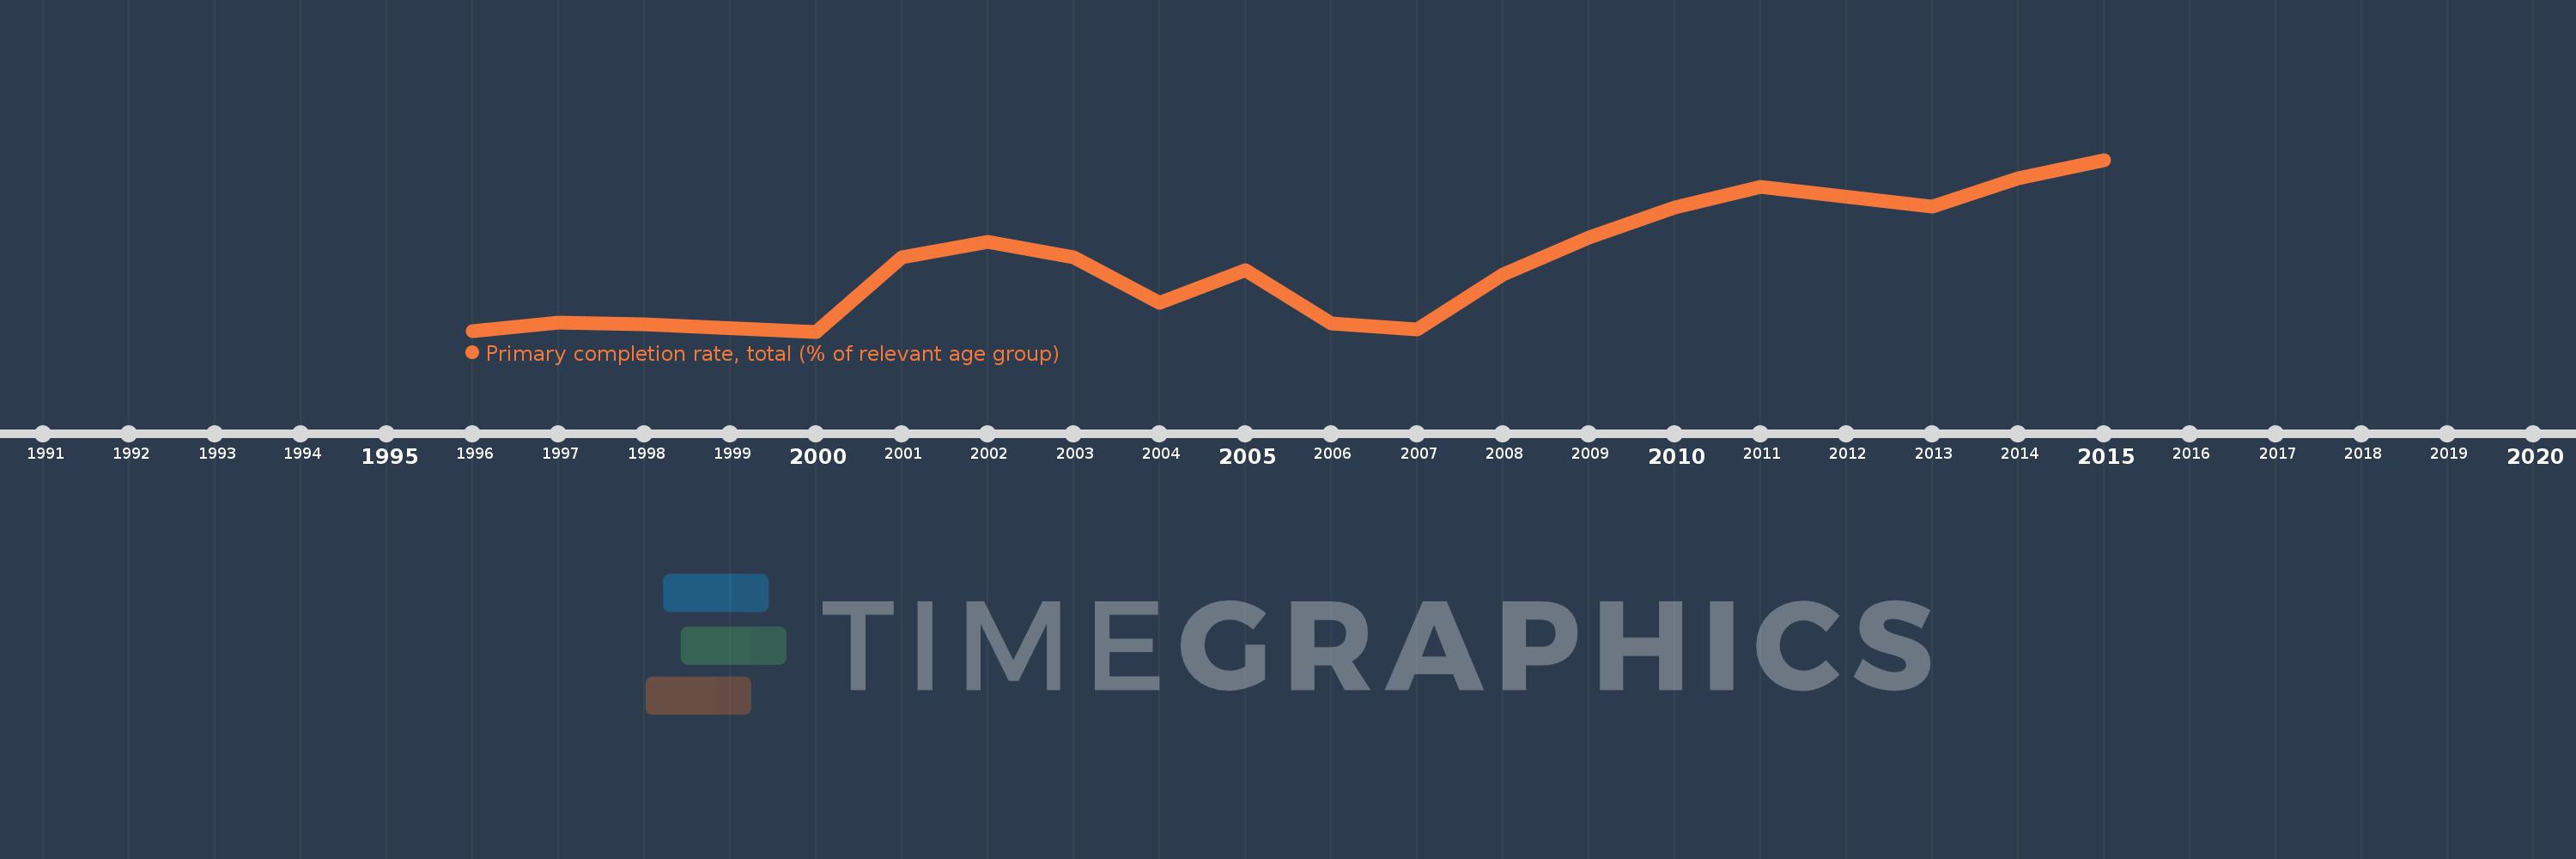
Questa scala temporale mostra un grafico dal 1996 anno al 2015 anno. Georgia. I dati fino ad 1995 anno non disponibili. Il numero di osservazioni attuali secondo i date: 18.
La fonte (nome):
Indicatori dello sviluppo mondiale
La fonte (organizzazione):
United Nations Educational, Scientific, and Cultural Organization (UNESCO) Institute for Statistics.
Categorie:
Aid Effectiveness, Climate Change, Education
sono stati aggiornati
23 apr 2017 anni
Indicatori delle variazioni dei valori per anni
In media:
96.934
Minima:
84.149
1 gen 2000 anni
Massimo:
116.457
1 gen 2015 anni
Alla data di osservazione
Valore
Variazione assoluta
La variazione rispetto al valore precedente
1 gen 1996 anni
84.287
+84.287
0.0%
1 gen 1997 anni
85.834
+1.547
1.84%
1 gen 1998 anni
85.462
-0.372
-0.43%
1 gen 2000 anni
84.149
-1.313
-1.54%
1 gen 2001 anni
98.143
+13.994
16.63%
1 gen 2002 anni
100.961
+2.819
2.87%
1 gen 2003 anni
98.042
-2.919
-2.89%
1 gen 2004 anni
89.614
-8.428
-8.6%
1 gen 2005 anni
95.646
+6.031
6.73%
1 gen 2006 anni
85.679
-9.966
-10.42%
1 gen 2007 anni
84.551
-1.128
-1.32%
1 gen 2008 anni
94.854
+10.303
12.19%
1 gen 2009 anni
101.766
+6.912
7.29%
1 gen 2010 anni
107.505
+5.739
5.64%
1 gen 2011 anni
111.3
+3.795
3.53%
1 gen 2013 anni
107.593
-3.708
-3.33%
1 gen 2014 anni
112.962
+5.37
4.99%
1 gen 2015 anni
116.457
+3.495
3.09%
Classificazione dei paesi secondo i statistiche attuali per anni