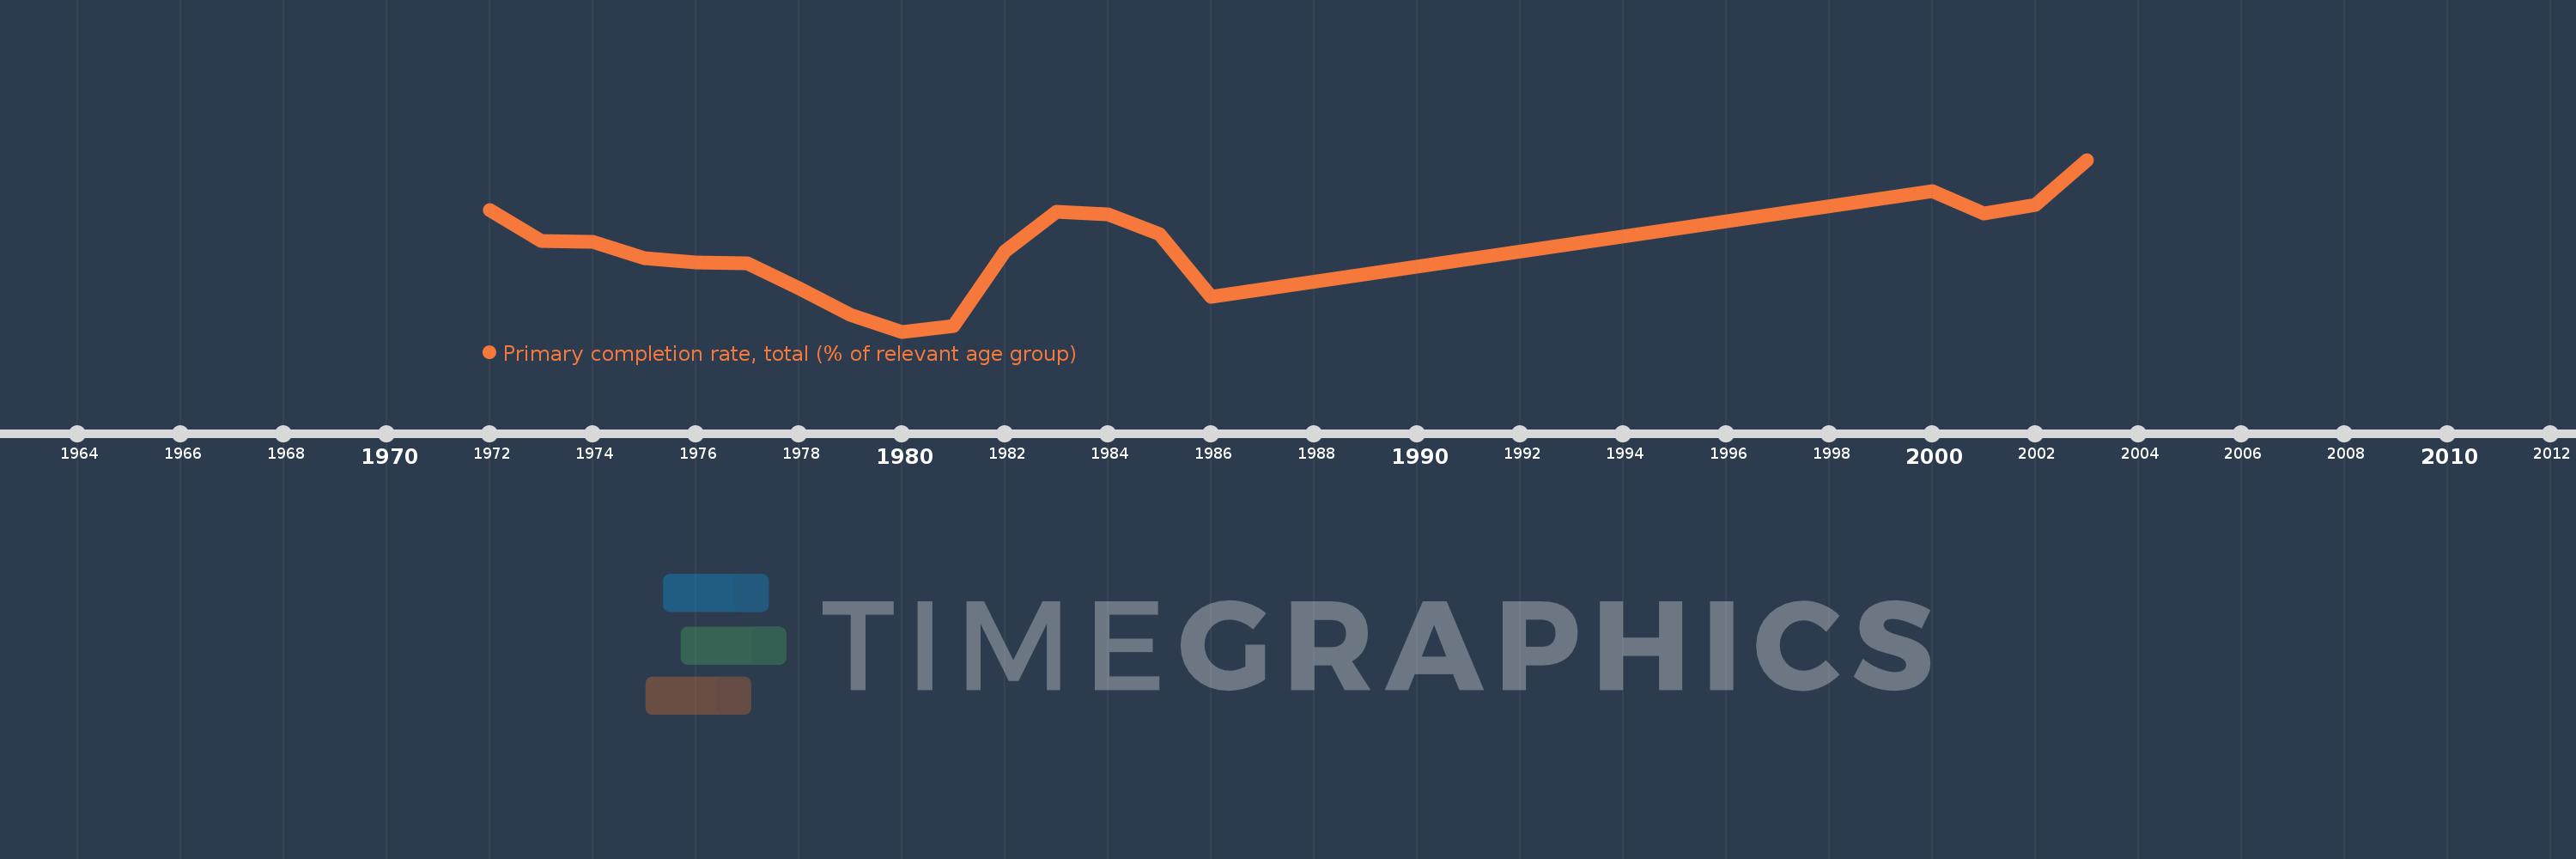
Questa scala temporale mostra un grafico dal 1972 anno al 2003 anno. Netherlands. I dati fino ad 1971 anno non disponibili. Il numero di osservazioni attuali secondo i date: 19.
La fonte (nome):
Indicatori dello sviluppo mondiale
La fonte (organizzazione):
United Nations Educational, Scientific, and Cultural Organization (UNESCO) Institute for Statistics.
Categorie:
Aid Effectiveness, Climate Change, Education
sono stati aggiornati
23 apr 2017 anni
Indicatori delle variazioni dei valori per anni
In media:
95.643
Minima:
90.393
1 gen 1980 anni
Massimo:
101.2
1 gen 2003 anni
Alla data di osservazione
Valore
Variazione assoluta
La variazione rispetto al valore precedente
1 gen 1972 anni
98.053
+98.053
0.0%
1 gen 1973 anni
96.116
-1.938
-1.98%
1 gen 1974 anni
96.013
-0.103
-0.11%
1 gen 1975 anni
94.995
-1.018
-1.06%
1 gen 1976 anni
94.764
-0.231
-0.24%
1 gen 1977 anni
94.708
-0.056
-0.06%
1 gen 1978 anni
93.147
-1.561
-1.65%
1 gen 1979 anni
91.456
-1.691
-1.81%
1 gen 1980 anni
90.393
-1.063
-1.16%
1 gen 1981 anni
90.729
+0.336
0.37%
1 gen 1982 anni
95.457
+4.727
5.21%
1 gen 1983 anni
97.918
+2.462
2.58%
1 gen 1984 anni
97.773
-0.146
-0.15%
1 gen 1985 anni
96.508
-1.265
-1.29%
1 gen 1986 anni
92.591
-3.917
-4.06%
1 gen 2000 anni
99.208
+6.616
7.15%
1 gen 2001 anni
97.819
-1.389
-1.4%
1 gen 2002 anni
98.37
+0.551
0.56%
1 gen 2003 anni
101.2
+2.83
2.88%
Classificazione dei paesi secondo i statistiche attuali per anni