30
/it/
AIzaSyAYiBZKx7MnpbEhh9jyipgxe19OcubqV5w
April 1, 2024
78979
Bangladesh
BGD
true
2
1
Stocks traded, total value (% of GDP)
2016,2015,2014,2013,2012,2011,2010,2009,2008,2007,2006,2005,2004,2003,2002,2001,2000,1999,1998,1997,1996,1995,1994
Download
Biblioteca di statistiche globali →Bangladesh →

Stocks traded, total value (% of GDP)

Queste statistiche in altri paesi:

Arab WorldArgentinaArmeniaAustraliaAustriaBahrainBangladeshBarbadosBelgiumBermudaBoliviaBotswanaBrazilBulgariaCanadaCayman IslandsCentral Europe and the BalticsChannel IslandsChileChinaColombiaCosta RicaCote d'IvoireCroatiaCyprusCzech RepublicDenmarkEarly-demographic dividendEast Asia & PacificEast Asia & Pacific (excluding high income)East Asia & Pacific (IDA & IBRD countries)EcuadorEgypt, Arab Rep.El SalvadorEstoniaEuro areaEurope & Central AsiaEurope & Central Asia (excluding high income)Europe & Central Asia (IDA & IBRD countries)European UnionFijiFinlandFranceGeorgiaGermanyGhanaGreeceGuyanaHigh incomeHong Kong SAR, ChinaHungaryIBRD onlyIcelandIDA & IBRD totalIDA blendIDA totalIndiaIndonesiaIran, Islamic Rep.IrelandIsraelItalyJamaicaJapanJordanKazakhstanKenyaKorea, Rep.KuwaitKyrgyz RepublicLate-demographic dividendLatin America & Caribbean Latin America & Caribbean (excluding high income)Latin America & the Caribbean (IDA & IBRD countries)LatviaLebanonLithuaniaLow & middle incomeLower middle incomeLuxembourgMacedonia, FYRMalawiMalaysiaMaltaMauritiusMexicoMiddle East & North AfricaMiddle East & North Africa (excluding high income)Middle East & North Africa (IDA & IBRD countries)Middle incomeMoldovaMongoliaMontenegroMoroccoNamibiaNetherlandsNew ZealandNigeriaNorth AmericaNorwayOECD membersOmanOther small statesPakistanPanamaPapua New GuineaParaguayPeruPhilippinesPolandPortugalPost-demographic dividendQatarRomaniaRussian FederationSaudi ArabiaSerbiaSeychellesSingaporeSlovak RepublicSloveniaSouth AfricaSouth AsiaSouth Asia (IDA & IBRD)SpainSri LankaSt. Kitts and NevisSub-Saharan Africa Sub-Saharan Africa (excluding high income)Sub-Saharan Africa (IDA & IBRD countries)SwazilandSwedenSwitzerlandTanzaniaThailandTrinidad and TobagoTunisiaTurkeyUgandaUkraineUnited Arab EmiratesUnited KingdomUnited StatesUpper middle incomeUruguayUzbekistanVenezuela, RBVietnamWest Bank and GazaWorldZambiaZimbabwe

Linea del tempo:

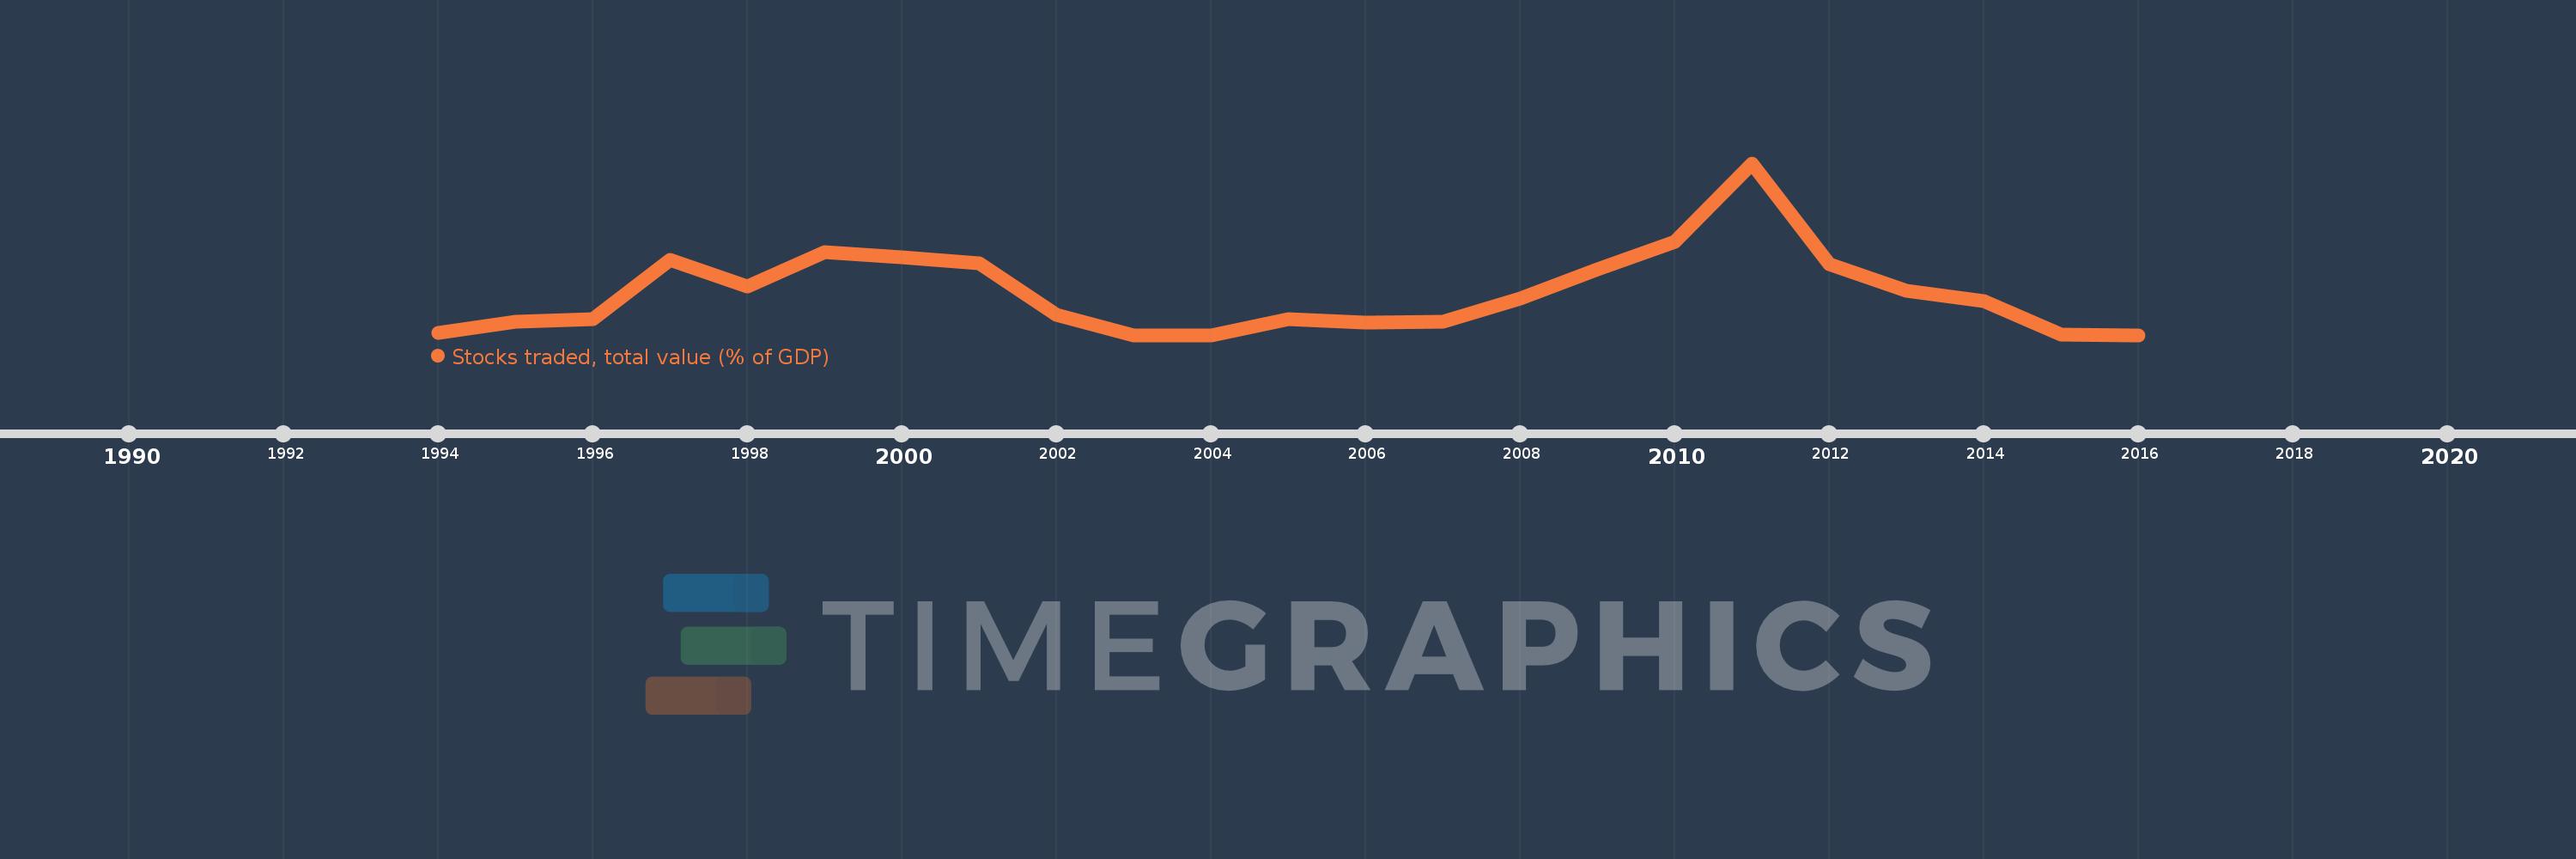
Questa scala temporale mostra un grafico dal 1994 anno al 2016 anno. Bangladesh. I dati fino ad 1993 anno non disponibili. Il numero di osservazioni attuali secondo i date: 23.

La fonte (nome):

Indicatori dello sviluppo mondiale

La fonte (organizzazione):

World Federation of Exchanges database.

Categorie:

Financial Sector

sono stati aggiornati

23 apr 2017 anni

Indicatori delle variazioni dei valori per anni

In media:
1.023
Minima:
0.0
1 gen 2003 anni
Massimo:
4.196
1 gen 2011 anni
Alla data di osservazione
Valore
Variazione assoluta
La variazione rispetto al valore precedente
1 gen 1994 anni
0.045
+0.045
0.0%
1 gen 1995 anni
0.319
+0.274
614.73%
1 gen 1996 anni
0.396
+0.077
24.01%
1 gen 1997 anni
1.837
+1.441
364.38%
1 gen 1998 anni
1.18
-0.657
-35.77%
1 gen 1999 anni
2.018
+0.838
71.08%
1 gen 2000 anni
1.889
-0.129
-6.41%
1 gen 2001 anni
1.753
-0.136
-7.19%
1 gen 2002 anni
0.484
-1.269
-72.41%
1 gen 2003 anni
0.0
-0.484
-100.0%
1 gen 2004 anni
0.0
0.0
%
1 gen 2005 anni
0.381
+0.381
%
1 gen 2006 anni
0.296
-0.085
-22.32%
1 gen 2007 anni
0.329
+0.033
11.24%
1 gen 2008 anni
0.889
+0.56
170.01%
1 gen 2009 anni
1.595
+0.706
79.41%
1 gen 2010 anni
2.283
+0.688
43.1%
1 gen 2011 anni
4.196
+1.914
83.83%
1 gen 2012 anni
1.729
-2.467
-58.79%
1 gen 2013 anni
1.082
-0.647
-37.42%
1 gen 2014 anni
0.824
-0.258
-23.85%
1 gen 2015 anni
0.001
-0.823
-99.9%
1 gen 2016 anni
0.0
-0.001
-100.0%

Classificazione dei paesi secondo i statistiche attuali per anni