29
/it/
it
AIzaSyAYiBZKx7MnpbEhh9jyipgxe19OcubqV5w
April 1, 2024
156750
Indonesia
IDN
true
2
1
Stocks traded, total value (% of GDP)
2016,2015,2014,2013,2012,2011,2010,2009,2008,2007,2006,2005,2004,2003,2002,2001,2000,1999,1998,1997,1996,1995,1994
Download
Biblioteca di statistiche globali →Indonesia →

Stocks traded, total value (% of GDP)

Queste statistiche in altri paesi:
Arab WorldArgentinaArmeniaAustraliaAustriaBahrainBangladeshBarbadosBelgiumBermudaBoliviaBotswanaBrazilBulgariaCanadaCayman IslandsCentral Europe and the BalticsChannel IslandsChileChinaColombiaCosta RicaCote d'IvoireCroatiaCyprusCzech RepublicDenmarkEarly-demographic dividendEast Asia & PacificEast Asia & Pacific (excluding high income)East Asia & Pacific (IDA & IBRD countries)EcuadorEgypt, Arab Rep.El SalvadorEstoniaEuro areaEurope & Central AsiaEurope & Central Asia (excluding high income)Europe & Central Asia (IDA & IBRD countries)European UnionFijiFinlandFranceGeorgiaGermanyGhanaGreeceGuyanaHigh incomeHong Kong SAR, ChinaHungaryIBRD onlyIcelandIDA & IBRD totalIDA blendIDA totalIndiaIndonesiaIran, Islamic Rep.IrelandIsraelItalyJamaicaJapanJordanKazakhstanKenyaKorea, Rep.KuwaitKyrgyz RepublicLate-demographic dividendLatin America & Caribbean Latin America & Caribbean (excluding high income)Latin America & the Caribbean (IDA & IBRD countries)LatviaLebanonLithuaniaLow & middle incomeLower middle incomeLuxembourgMacedonia, FYRMalawiMalaysiaMaltaMauritiusMexicoMiddle East & North AfricaMiddle East & North Africa (excluding high income)Middle East & North Africa (IDA & IBRD countries)Middle incomeMoldovaMongoliaMontenegroMoroccoNamibiaNetherlandsNew ZealandNigeriaNorth AmericaNorwayOECD membersOmanOther small statesPakistanPanamaPapua New GuineaParaguayPeruPhilippinesPolandPortugalPost-demographic dividendQatarRomaniaRussian FederationSaudi ArabiaSerbiaSeychellesSingaporeSlovak RepublicSloveniaSouth AfricaSouth AsiaSouth Asia (IDA & IBRD)SpainSri LankaSt. Kitts and NevisSub-Saharan Africa Sub-Saharan Africa (excluding high income)Sub-Saharan Africa (IDA & IBRD countries)SwazilandSwedenSwitzerlandTanzaniaThailandTrinidad and TobagoTunisiaTurkeyUgandaUkraineUnited Arab EmiratesUnited KingdomUnited StatesUpper middle incomeUruguayUzbekistanVenezuela, RBVietnamWest Bank and GazaWorldZambiaZimbabwe
Linea del tempo:
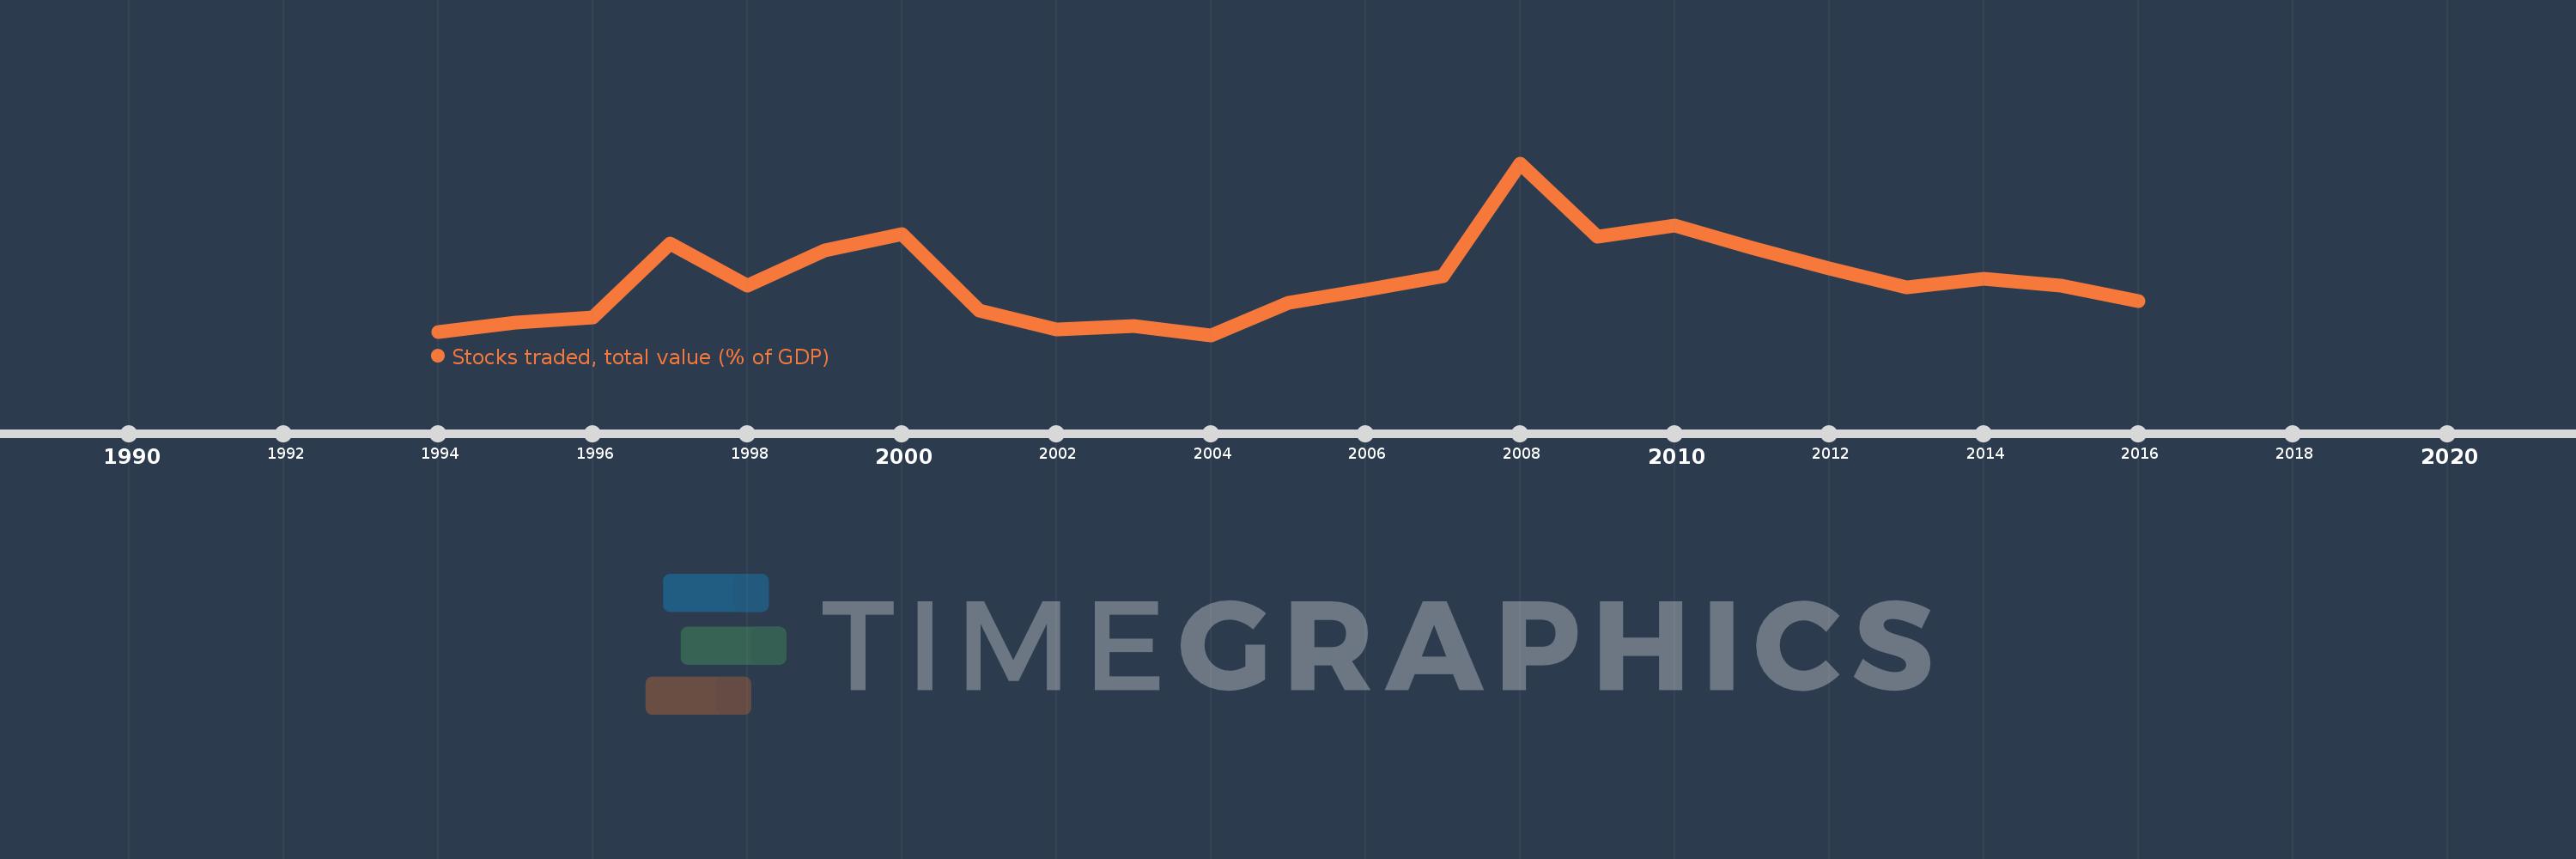
Questa scala temporale mostra un grafico dal 1994 anno al 2016 anno. Indonesia. I dati fino ad 1993 anno non disponibili. Il numero di osservazioni attuali secondo i date: 23.
La fonte (nome):
Indicatori dello sviluppo mondiale
La fonte (organizzazione):
World Federation of Exchanges database.
Categorie:
Financial Sector
sono stati aggiornati
23 apr 2017 anni
Indicatori delle variazioni dei valori per anni
In media:
10.684
Minima:
5.435
1 gen 2004 anni
Massimo:
21.96
1 gen 2008 anni
Alla data di osservazione
Valore
Variazione assoluta
La variazione rispetto al valore precedente
1 gen 1994 anni
5.752
+5.752
0.0%
1 gen 1995 anni
6.664
+0.912
15.85%
1 gen 1996 anni
7.111
+0.448
6.72%
1 gen 1997 anni
14.267
+7.155
100.62%
1 gen 1998 anni
10.195
-4.072
-28.54%
1 gen 1999 anni
13.548
+3.353
32.89%
1 gen 2000 anni
15.115
+1.567
11.57%
1 gen 2001 anni
7.818
-7.297
-48.28%
1 gen 2002 anni
6.007
-1.811
-23.17%
1 gen 2003 anni
6.331
+0.324
5.4%
1 gen 2004 anni
5.435
-0.896
-14.15%
1 gen 2005 anni
8.519
+3.083
56.73%
1 gen 2006 anni
9.745
+1.227
14.4%
1 gen 2007 anni
11.06
+1.315
13.49%
1 gen 2008 anni
21.96
+10.899
98.54%
1 gen 2009 anni
14.866
-7.094
-32.3%
1 gen 2010 anni
15.952
+1.086
7.31%
1 gen 2011 anni
13.833
-2.119
-13.28%
1 gen 2012 anni
11.812
-2.021
-14.61%
1 gen 2013 anni
10.016
-1.796
-15.21%
1 gen 2014 anni
10.833
+0.818
8.17%
1 gen 2015 anni
10.188
-0.646
-5.96%
1 gen 2016 anni
8.707
-1.481
-14.54%
Classificazione dei paesi secondo i statistiche attuali per anni

Commenti:

Inviare
PremiumAbout & FeedbackAccordoPrivatezza
logo
© 2022 Selected Technologies LLC – Morgan Hill, California