33
/it/
AIzaSyAYiBZKx7MnpbEhh9jyipgxe19OcubqV5w
May 1, 2025
242134
Slovak Republic
SVK
true
2
1
Stocks traded, total value (% of GDP)
2014,2013,2012,2011,2010,2009,2008,2007,2006,2005,2004,2003,2002,2001,2000,1999,1998,1997,1996,1995,1994
Download
Biblioteca di statistiche globali →Slovak Republic →

Stocks traded, total value (% of GDP)

Queste statistiche in altri paesi:

Arab WorldArgentinaArmeniaAustraliaAustriaBahrainBangladeshBarbadosBelgiumBermudaBoliviaBotswanaBrazilBulgariaCanadaCayman IslandsCentral Europe and the BalticsChannel IslandsChileChinaColombiaCosta RicaCote d'IvoireCroatiaCyprusCzech RepublicDenmarkEarly-demographic dividendEast Asia & PacificEast Asia & Pacific (excluding high income)East Asia & Pacific (IDA & IBRD countries)EcuadorEgypt, Arab Rep.El SalvadorEstoniaEuro areaEurope & Central AsiaEurope & Central Asia (excluding high income)Europe & Central Asia (IDA & IBRD countries)European UnionFijiFinlandFranceGeorgiaGermanyGhanaGreeceGuyanaHigh incomeHong Kong SAR, ChinaHungaryIBRD onlyIcelandIDA & IBRD totalIDA blendIDA totalIndiaIndonesiaIran, Islamic Rep.IrelandIsraelItalyJamaicaJapanJordanKazakhstanKenyaKorea, Rep.KuwaitKyrgyz RepublicLate-demographic dividendLatin America & Caribbean Latin America & Caribbean (excluding high income)Latin America & the Caribbean (IDA & IBRD countries)LatviaLebanonLithuaniaLow & middle incomeLower middle incomeLuxembourgMacedonia, FYRMalawiMalaysiaMaltaMauritiusMexicoMiddle East & North AfricaMiddle East & North Africa (excluding high income)Middle East & North Africa (IDA & IBRD countries)Middle incomeMoldovaMongoliaMontenegroMoroccoNamibiaNetherlandsNew ZealandNigeriaNorth AmericaNorwayOECD membersOmanOther small statesPakistanPanamaPapua New GuineaParaguayPeruPhilippinesPolandPortugalPost-demographic dividendQatarRomaniaRussian FederationSaudi ArabiaSerbiaSeychellesSingaporeSlovak RepublicSloveniaSouth AfricaSouth AsiaSouth Asia (IDA & IBRD)SpainSri LankaSt. Kitts and NevisSub-Saharan Africa Sub-Saharan Africa (excluding high income)Sub-Saharan Africa (IDA & IBRD countries)SwazilandSwedenSwitzerlandTanzaniaThailandTrinidad and TobagoTunisiaTurkeyUgandaUkraineUnited Arab EmiratesUnited KingdomUnited StatesUpper middle incomeUruguayUzbekistanVenezuela, RBVietnamWest Bank and GazaWorldZambiaZimbabwe

Linea del tempo:

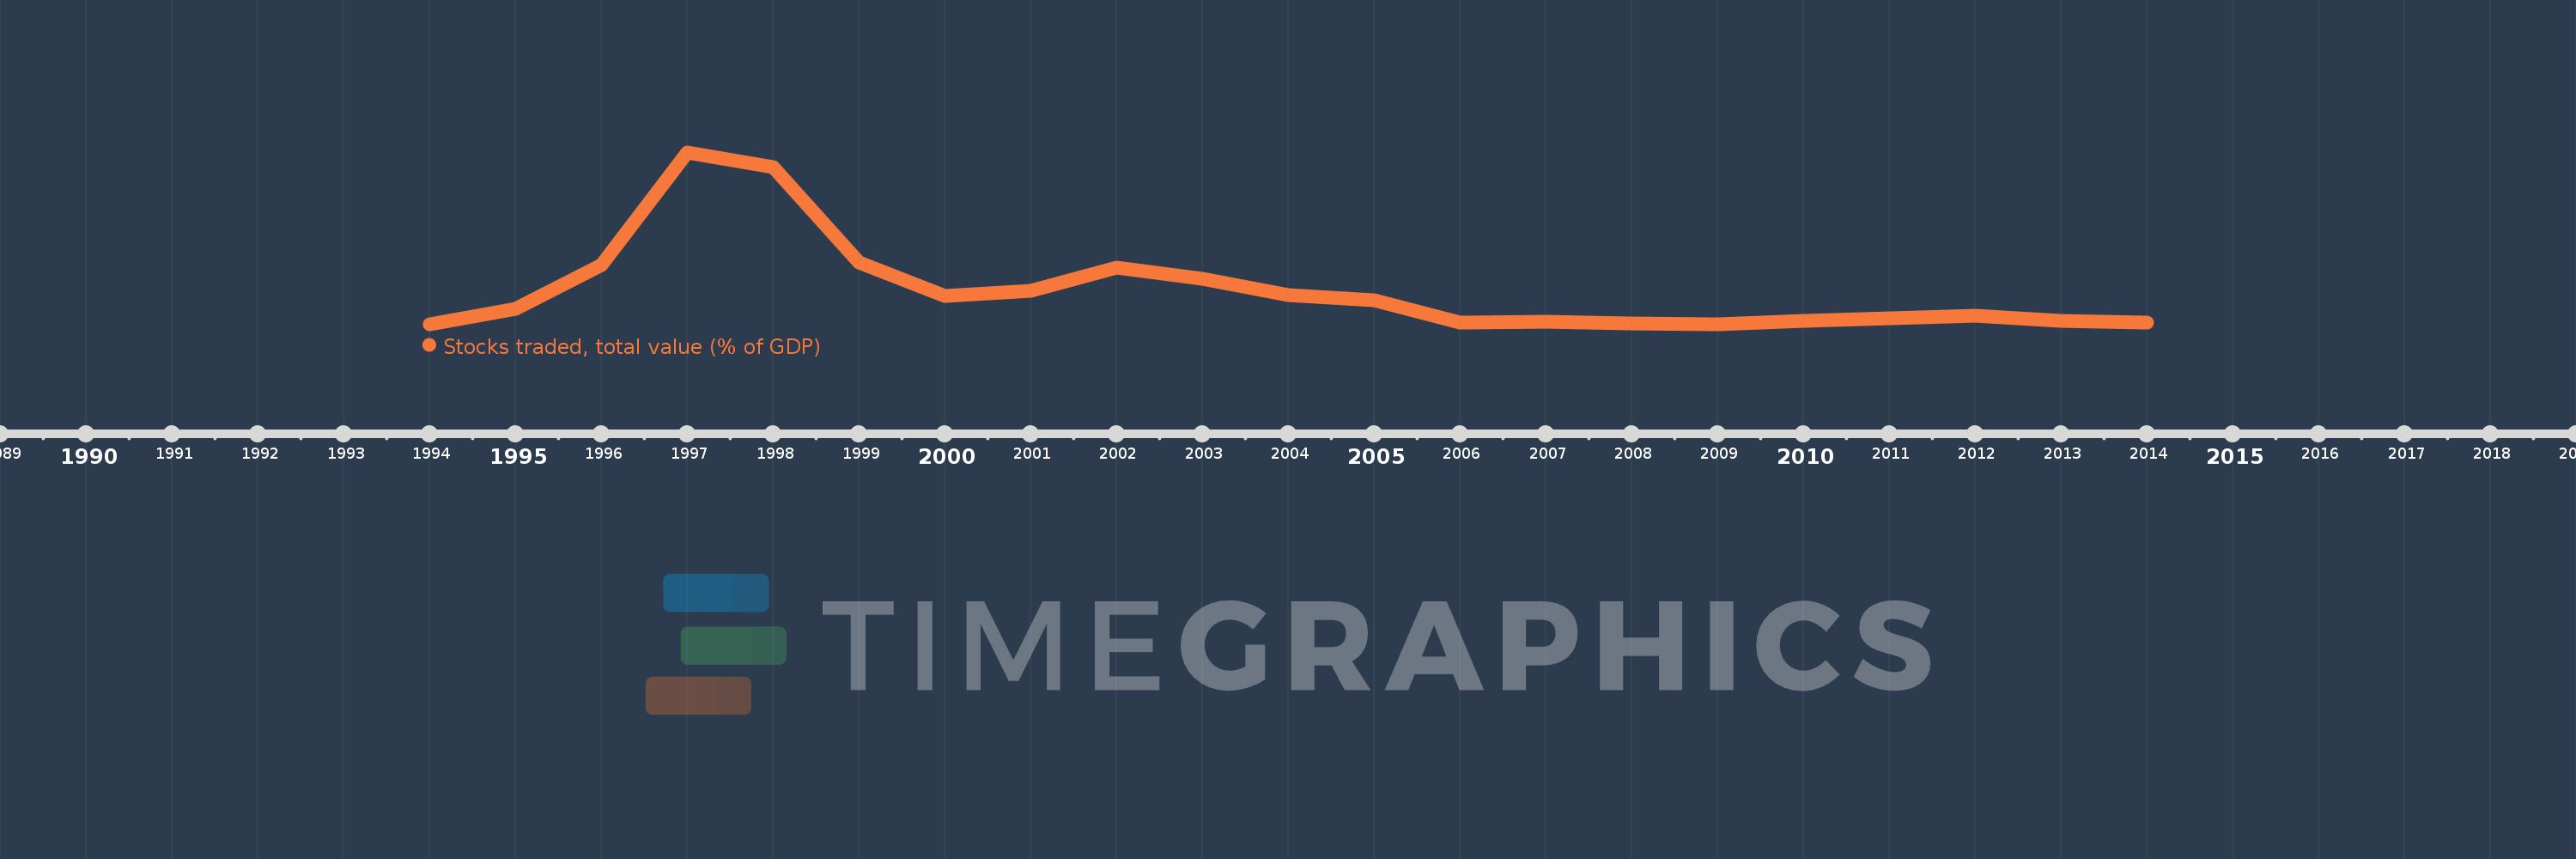
Questa scala temporale mostra un grafico dal 1994 anno al 2014 anno. Slovak Republic. I dati fino ad 1993 anno non disponibili. Il numero di osservazioni attuali secondo i date: 21.

La fonte (nome):

Indicatori dello sviluppo mondiale

La fonte (organizzazione):

World Federation of Exchanges database.

Categorie:

Financial Sector

sono stati aggiornati

23 apr 2017 anni

Indicatori delle variazioni dei valori per anni

In media:
1.856
Minima:
0.016
1 gen 1994 anni
Massimo:
9.371
1 gen 1997 anni
Alla data di osservazione
Valore
Variazione assoluta
La variazione rispetto al valore precedente
1 gen 1994 anni
0.016
+0.016
0.0%
1 gen 1995 anni
0.87
+0.854
5.2 Mille.%
1 gen 1996 anni
3.244
+2.374
272.82%
1 gen 1997 anni
9.371
+6.127
188.89%
1 gen 1998 anni
8.564
-0.807
-8.61%
1 gen 1999 anni
3.393
-5.171
-60.38%
1 gen 2000 anni
1.572
-1.821
-53.68%
1 gen 2001 anni
1.834
+0.263
16.7%
1 gen 2002 anni
3.105
+1.27
69.27%
1 gen 2003 anni
2.511
-0.594
-19.12%
1 gen 2004 anni
1.597
-0.913
-36.38%
1 gen 2005 anni
1.311
-0.286
-17.92%
1 gen 2006 anni
0.106
-1.205
-91.92%
1 gen 2007 anni
0.141
+0.035
33.08%
1 gen 2008 anni
0.036
-0.105
-74.29%
1 gen 2009 anni
0.021
-0.015
-42.01%
1 gen 2010 anni
0.196
+0.175
834.66%
1 gen 2011 anni
0.345
+0.149
75.74%
1 gen 2012 anni
0.461
+0.116
33.64%
1 gen 2013 anni
0.178
-0.283
-61.32%
1 gen 2014 anni
0.111
-0.067
-37.6%

Classificazione dei paesi secondo i statistiche attuali per anni