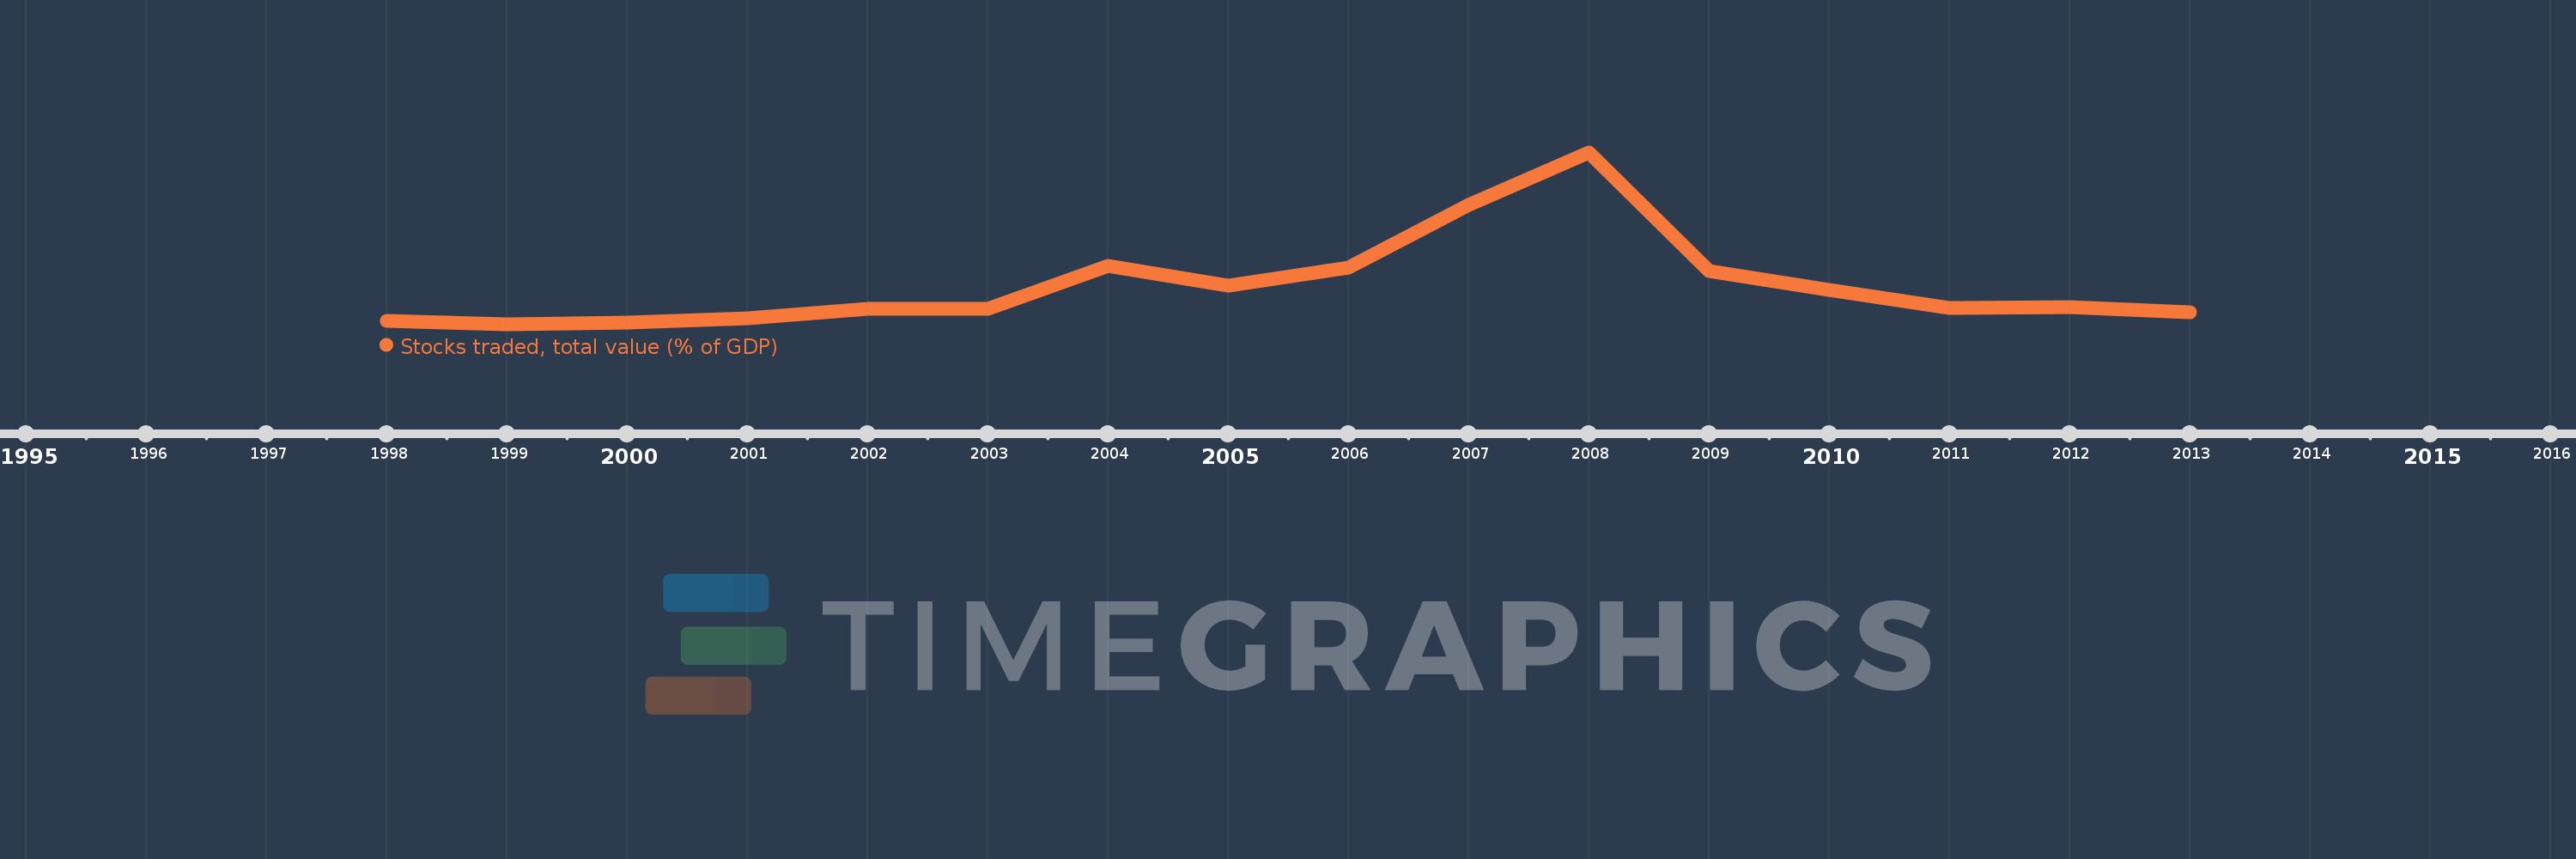
Questa scala temporale mostra un grafico dal 1998 anno al 2013 anno. Serbia. I dati fino ad 1997 anno non disponibili. Il numero di osservazioni attuali secondo i date: 16.
La fonte (nome):
Indicatori dello sviluppo mondiale
La fonte (organizzazione):
World Federation of Exchanges database.
Categorie:
Financial Sector
sono stati aggiornati
23 apr 2017 anni
Indicatori delle variazioni dei valori per anni
In media:
1.778
Minima:
0.068
1 gen 1999 anni
Massimo:
7.677
1 gen 2008 anni
Alla data di osservazione
Valore
Variazione assoluta
La variazione rispetto al valore precedente
1 gen 1998 anni
0.201
+0.201
0.0%
1 gen 1999 anni
0.068
-0.132
-65.96%
1 gen 2000 anni
0.145
+0.077
112.15%
1 gen 2001 anni
0.336
+0.191
131.93%
1 gen 2002 anni
0.734
+0.397
118.11%
1 gen 2003 anni
0.733
-0.001
-0.12%
1 gen 2004 anni
2.651
+1.918
261.72%
1 gen 2005 anni
1.761
-0.89
-33.57%
1 gen 2006 anni
2.584
+0.823
46.77%
1 gen 2007 anni
5.334
+2.75
106.41%
1 gen 2008 anni
7.677
+2.342
43.91%
1 gen 2009 anni
2.41
-5.267
-68.61%
1 gen 2010 anni
1.598
-0.812
-33.7%
1 gen 2011 anni
0.796
-0.802
-50.2%
1 gen 2012 anni
0.823
+0.028
3.5%
1 gen 2013 anni
0.591
-0.233
-28.29%
Classificazione dei paesi secondo i statistiche attuali per anni