33
/it/
AIzaSyAYiBZKx7MnpbEhh9jyipgxe19OcubqV5w
August 1, 2025
77639
Bahrain
BHR
true
2
1
Stocks traded, total value (% of GDP)
2016,2015,2014,2013,2012,2011,2010,2009,2008,2007,2006,2005,2004,2002,2001,2000,1999,1998,1997,1996,1995
Download
Biblioteca di statistiche globali →Bahrain →

Stocks traded, total value (% of GDP)

Queste statistiche in altri paesi:

Arab WorldArgentinaArmeniaAustraliaAustriaBahrainBangladeshBarbadosBelgiumBermudaBoliviaBotswanaBrazilBulgariaCanadaCayman IslandsCentral Europe and the BalticsChannel IslandsChileChinaColombiaCosta RicaCote d'IvoireCroatiaCyprusCzech RepublicDenmarkEarly-demographic dividendEast Asia & PacificEast Asia & Pacific (excluding high income)East Asia & Pacific (IDA & IBRD countries)EcuadorEgypt, Arab Rep.El SalvadorEstoniaEuro areaEurope & Central AsiaEurope & Central Asia (excluding high income)Europe & Central Asia (IDA & IBRD countries)European UnionFijiFinlandFranceGeorgiaGermanyGhanaGreeceGuyanaHigh incomeHong Kong SAR, ChinaHungaryIBRD onlyIcelandIDA & IBRD totalIDA blendIDA totalIndiaIndonesiaIran, Islamic Rep.IrelandIsraelItalyJamaicaJapanJordanKazakhstanKenyaKorea, Rep.KuwaitKyrgyz RepublicLate-demographic dividendLatin America & Caribbean Latin America & Caribbean (excluding high income)Latin America & the Caribbean (IDA & IBRD countries)LatviaLebanonLithuaniaLow & middle incomeLower middle incomeLuxembourgMacedonia, FYRMalawiMalaysiaMaltaMauritiusMexicoMiddle East & North AfricaMiddle East & North Africa (excluding high income)Middle East & North Africa (IDA & IBRD countries)Middle incomeMoldovaMongoliaMontenegroMoroccoNamibiaNetherlandsNew ZealandNigeriaNorth AmericaNorwayOECD membersOmanOther small statesPakistanPanamaPapua New GuineaParaguayPeruPhilippinesPolandPortugalPost-demographic dividendQatarRomaniaRussian FederationSaudi ArabiaSerbiaSeychellesSingaporeSlovak RepublicSloveniaSouth AfricaSouth AsiaSouth Asia (IDA & IBRD)SpainSri LankaSt. Kitts and NevisSub-Saharan Africa Sub-Saharan Africa (excluding high income)Sub-Saharan Africa (IDA & IBRD countries)SwazilandSwedenSwitzerlandTanzaniaThailandTrinidad and TobagoTunisiaTurkeyUgandaUkraineUnited Arab EmiratesUnited KingdomUnited StatesUpper middle incomeUruguayUzbekistanVenezuela, RBVietnamWest Bank and GazaWorldZambiaZimbabwe

Linea del tempo:

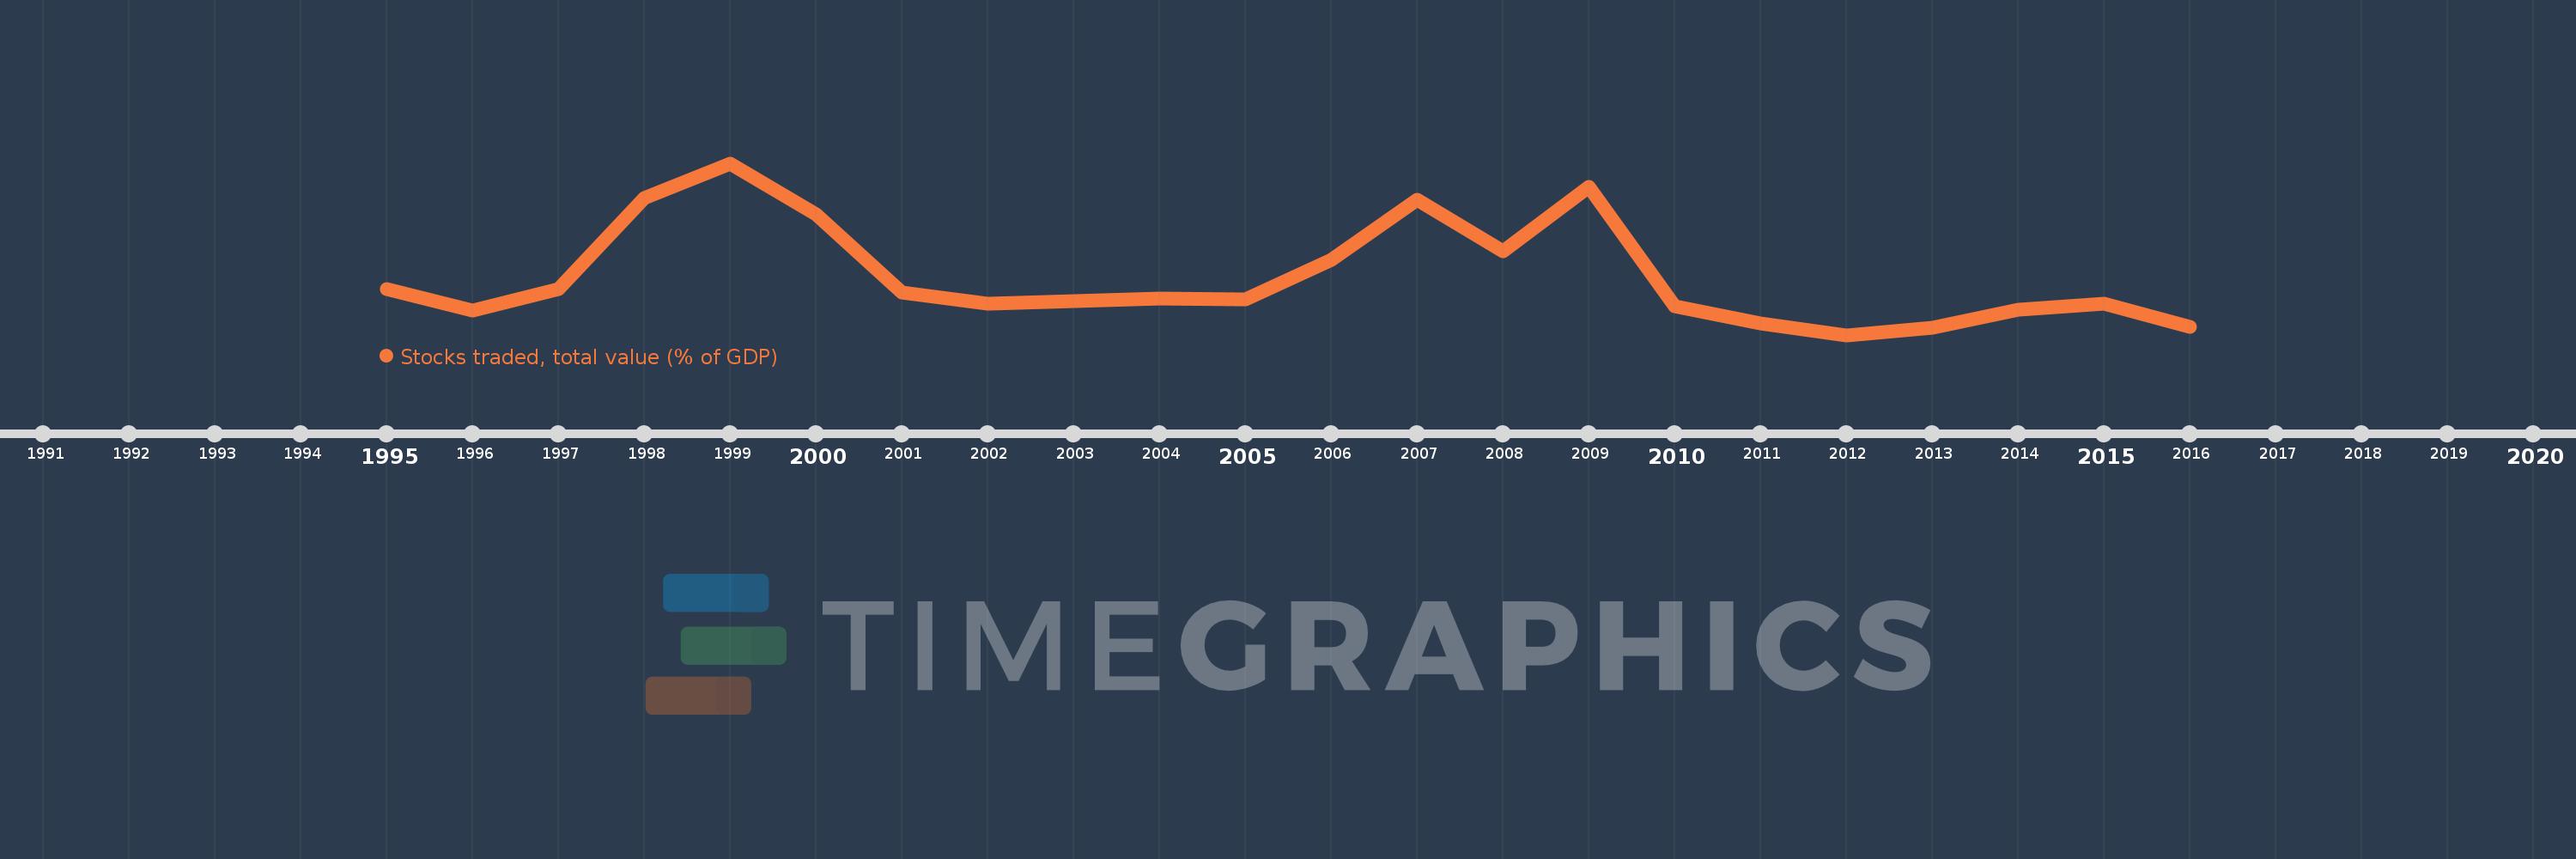
Questa scala temporale mostra un grafico dal 1995 anno al 2016 anno. Bahrain. I dati fino ad 1994 anno non disponibili. Il numero di osservazioni attuali secondo i date: 21.

La fonte (nome):

Indicatori dello sviluppo mondiale

La fonte (organizzazione):

World Federation of Exchanges database.

Categorie:

Financial Sector

sono stati aggiornati

23 apr 2017 anni

Indicatori delle variazioni dei valori per anni

In media:
3.578
Minima:
0.543
1 gen 2012 anni
Massimo:
9.321
1 gen 1999 anni
Alla data di osservazione
Valore
Variazione assoluta
La variazione rispetto al valore precedente
1 gen 1995 anni
2.877
+2.877
0.0%
1 gen 1996 anni
1.814
-1.064
-36.96%
1 gen 1997 anni
2.896
+1.082
59.65%
1 gen 1998 anni
7.552
+4.656
160.79%
1 gen 1999 anni
9.321
+1.769
23.42%
1 gen 2000 anni
6.727
-2.594
-27.83%
1 gen 2001 anni
2.708
-4.019
-59.74%
1 gen 2002 anni
2.133
-0.575
-21.22%
1 gen 2004 anni
2.408
+0.275
12.89%
1 gen 2005 anni
2.37
-0.039
-1.6%
1 gen 2006 anni
4.398
+2.028
85.58%
1 gen 2007 anni
7.463
+3.066
69.71%
1 gen 2008 anni
4.808
-2.656
-35.58%
1 gen 2009 anni
8.104
+3.296
68.56%
1 gen 2010 anni
2.033
-6.071
-74.92%
1 gen 2011 anni
1.118
-0.914
-44.98%
1 gen 2012 anni
0.543
-0.576
-51.49%
1 gen 2013 anni
0.905
+0.363
66.87%
1 gen 2014 anni
1.858
+0.953
105.22%
1 gen 2015 anni
2.15
+0.292
15.71%
1 gen 2016 anni
0.945
-1.205
-56.06%

Classificazione dei paesi secondo i statistiche attuali per anni